
The console
You reach it at https://<box-ip>:8443. First-run brings you to the setup wizard (see the Quick Start). After that, you land on Dashboard.
The left nav is grouped into four sections:
| Group | Purpose |
|---|---|
| OPERATIONS | What's happening right now — live counters, sessions, health, audit trail |
| CONFIGURE | The knobs — pools, plans, subscribers, portal, dataplane |
| PLATFORM | About page, hardware inventory |
| SIMULATOR | CPESIM (only visible if the CPESIM plugin is installed) |
Header pills are the always-on status snapshot. Green = OK, amber = warning, red = action needed:
- VPP — dataplane up? If
?for more than 10s, the controller can't reach vpp-bridge (see Troubleshooting). - AAA · Local · gated (or
open) — provider health + mode.Local · unreachablemeans the local AAA store isn't loading. - Sessions: N — current onboarded subscriber count.
- N warnings (amber shield) — click to see open events (unread events also show as a badge next to Dashboard in the nav).
Dashboard
The operator's home screen. Six top-line KPIs plus two live throughput charts and three panels.
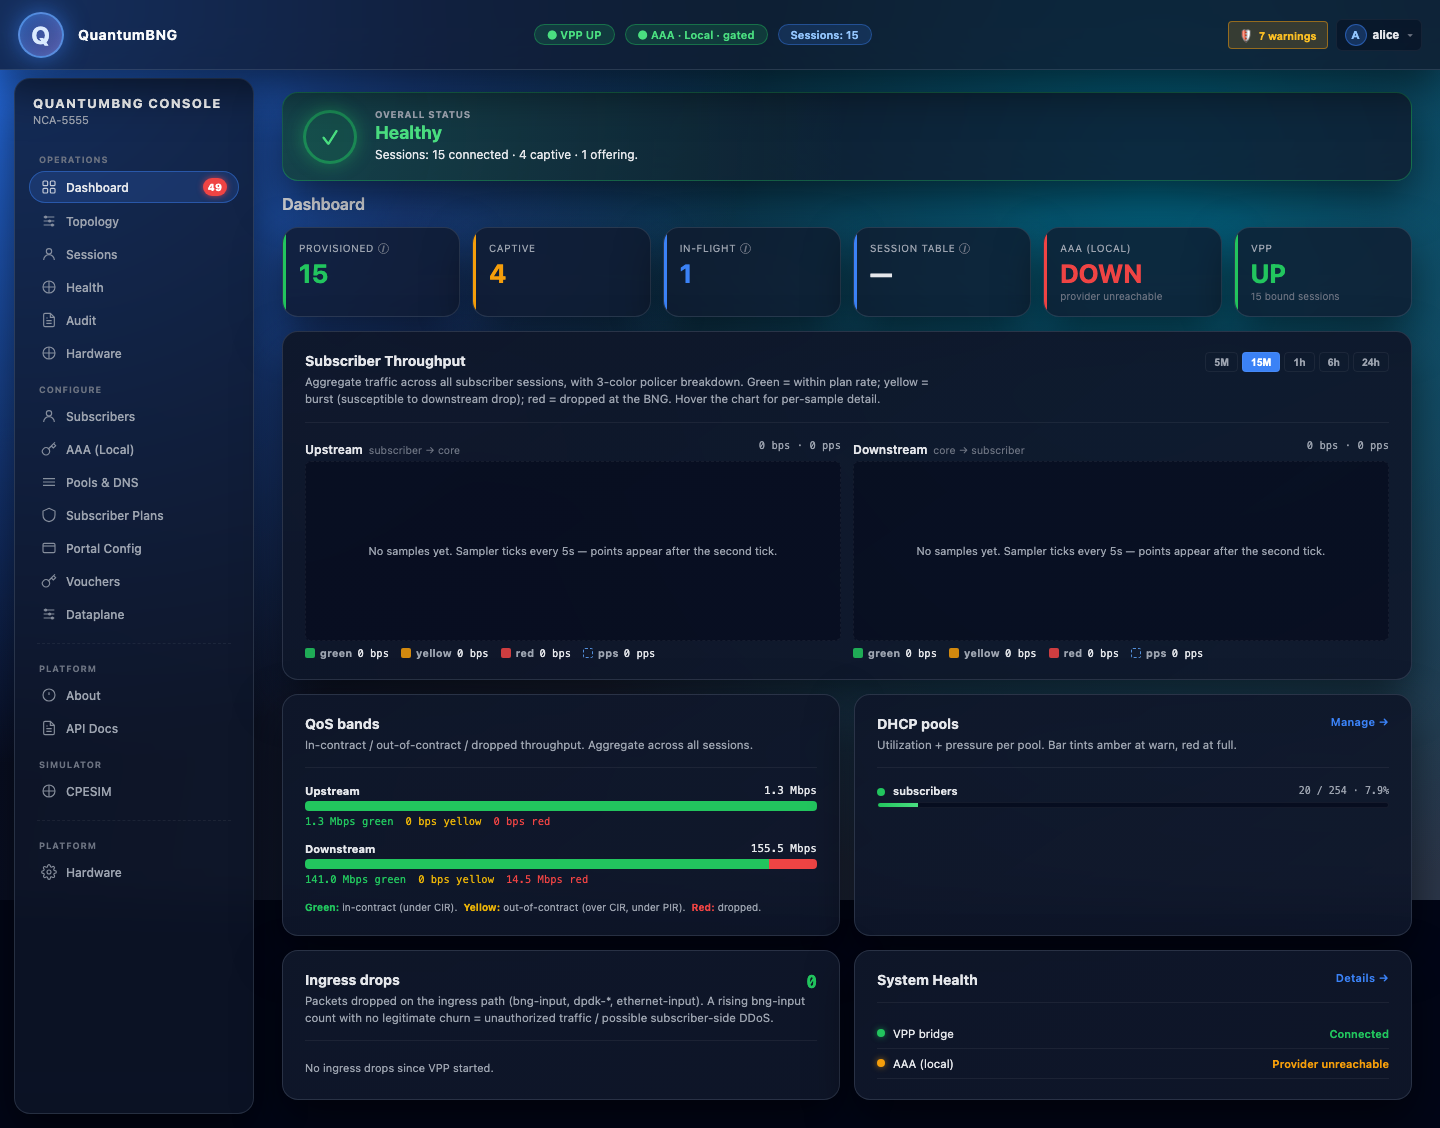
KPIs (top row, left to right):
| KPI | What it means | When to look |
|---|---|---|
| Provisioned | Subscribers currently CONNECTED (have an IP, on their plan) | Baseline health |
| Captive | Subscribers redirected to portal (unprovisioned or awaiting login) | Rising during business hours = provisioning workflow lag |
| In-flight | Sessions mid-DORA (OFFERING or REQUESTING) | > 10 for more than 30s = reply-path stall |
| Session Table | VPP-side session-slot occupancy | Approaches 1000 = at Community Edition cap |
| AAA (Local) | Local AAA provider health | DOWN = users can't authenticate (see AAA (Local)) |
| VPP | Dataplane status + bound-session count | UP N bound sessions — should match Provisioned KPI |
Subscriber Throughput — two stacked-area charts, upstream and downstream. Each shows the 3-color QoS breakdown: green = within CIR (in-contract), yellow = between CIR and PIR (burst), red = dropped by the policer. Time-range picker top-right (5M / 15M / 1H / 6H / 24H).
QoS bands — same three colors as the throughput chart but as a rolling-average bar per direction. Use the throughput chart to see when a spike happened; use the bands to see the current split.
DHCP pools — per-pool utilization bar. Tints amber at warn threshold, red at full. Click Manage to jump to Pools & DNS.
Ingress drops — a counter of packets dropped on the ingress path (bng-input, dpdk-*, ethernet-input). A rising count with no legitimate churn typically means unauthorized traffic or subscriber-side DDoS.
System Health — one-liner status of each subsystem. Click Details for the full Health page.
Topology
Live map of every element in the packet path — from CPEs on the left to the core router on the right.
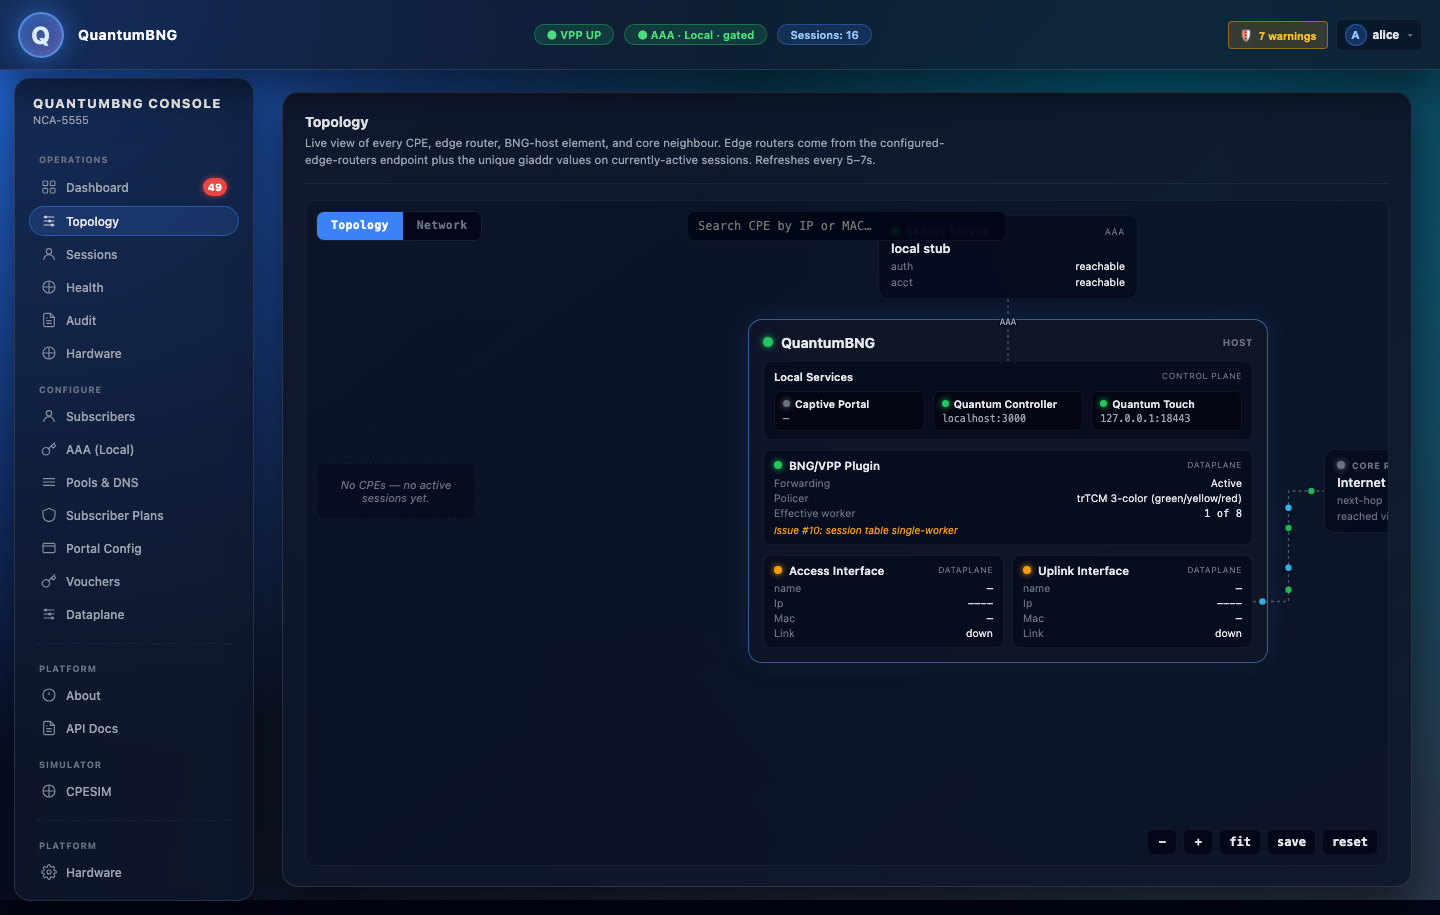
Green dots = healthy. Amber = warning (e.g., access interface down because no cable). Red = broken. Hovers on each element give you IP, MAC, driver, throughput.
Two tabs: Topology — network connectivity + per-element status (the view above) — and Network — bandwidth measurements at key points in the system (edge, uplink, per-interface throughput).
Sessions
Every current subscriber session. Filter by state (Connected / Captive / Offering / All), search by IP / MAC / plan / giaddr.
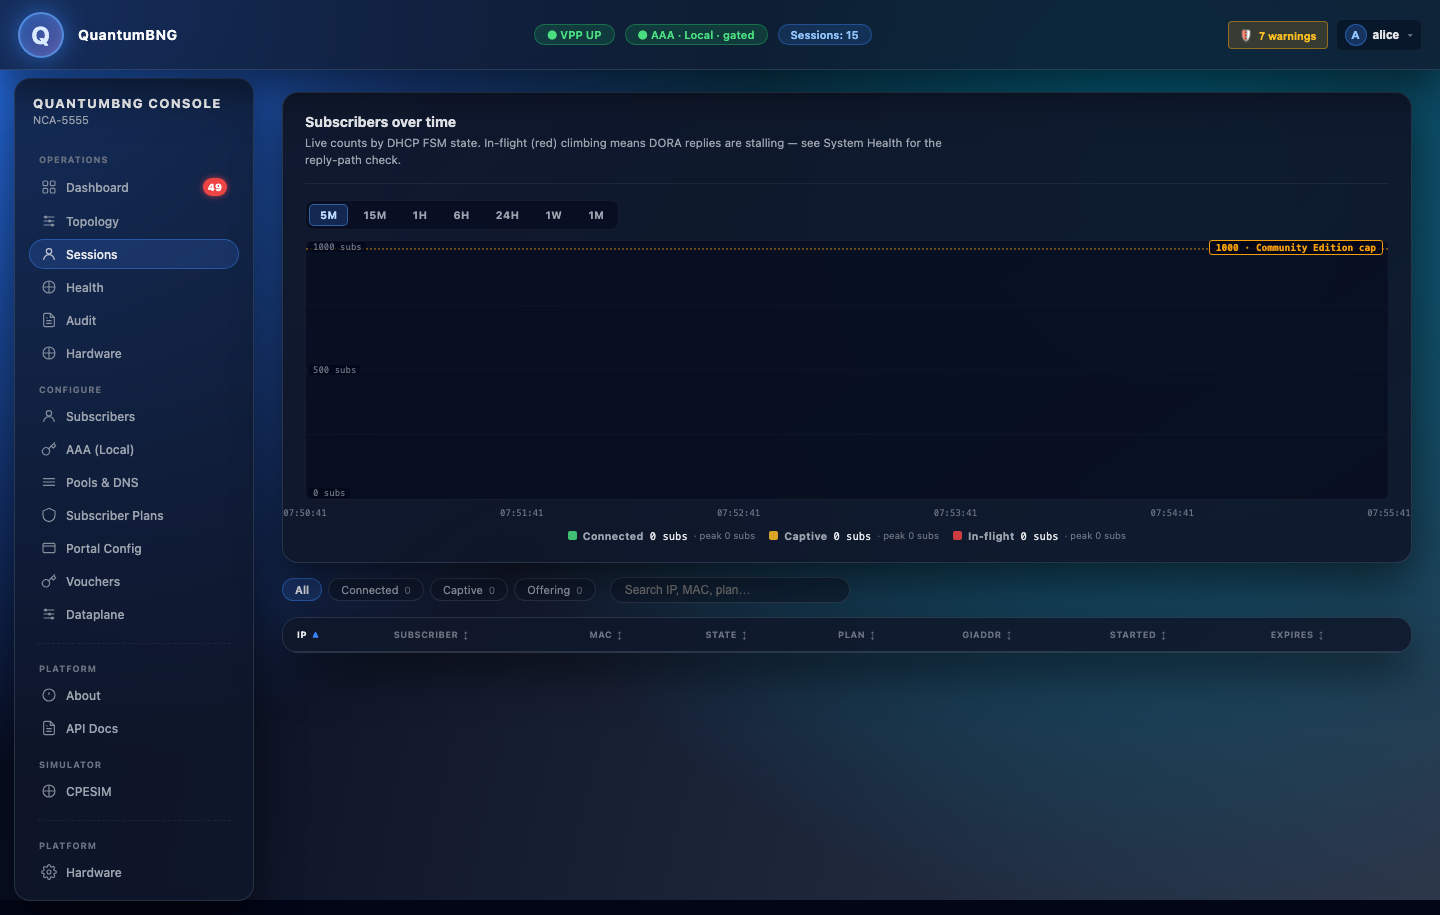
The "Subscribers over time" chart at the top shows connected + captive + in-flight over your chosen range. Persistent in-flight (red) with low connected typically means the DHCP reply path is stalled — see the Health page's reply-path check.
Click any session row to open the Session Drawer (right-side panel): live per-session traffic sparkline, session events (DORA, plan changes, disconnects), operator actions (disconnect, re-rate, move to captive).
Health
Subsystem-by-subsystem diagnostic page. Every check has a green/amber/red pill, a description of what the check verifies, and a "why this matters" note.
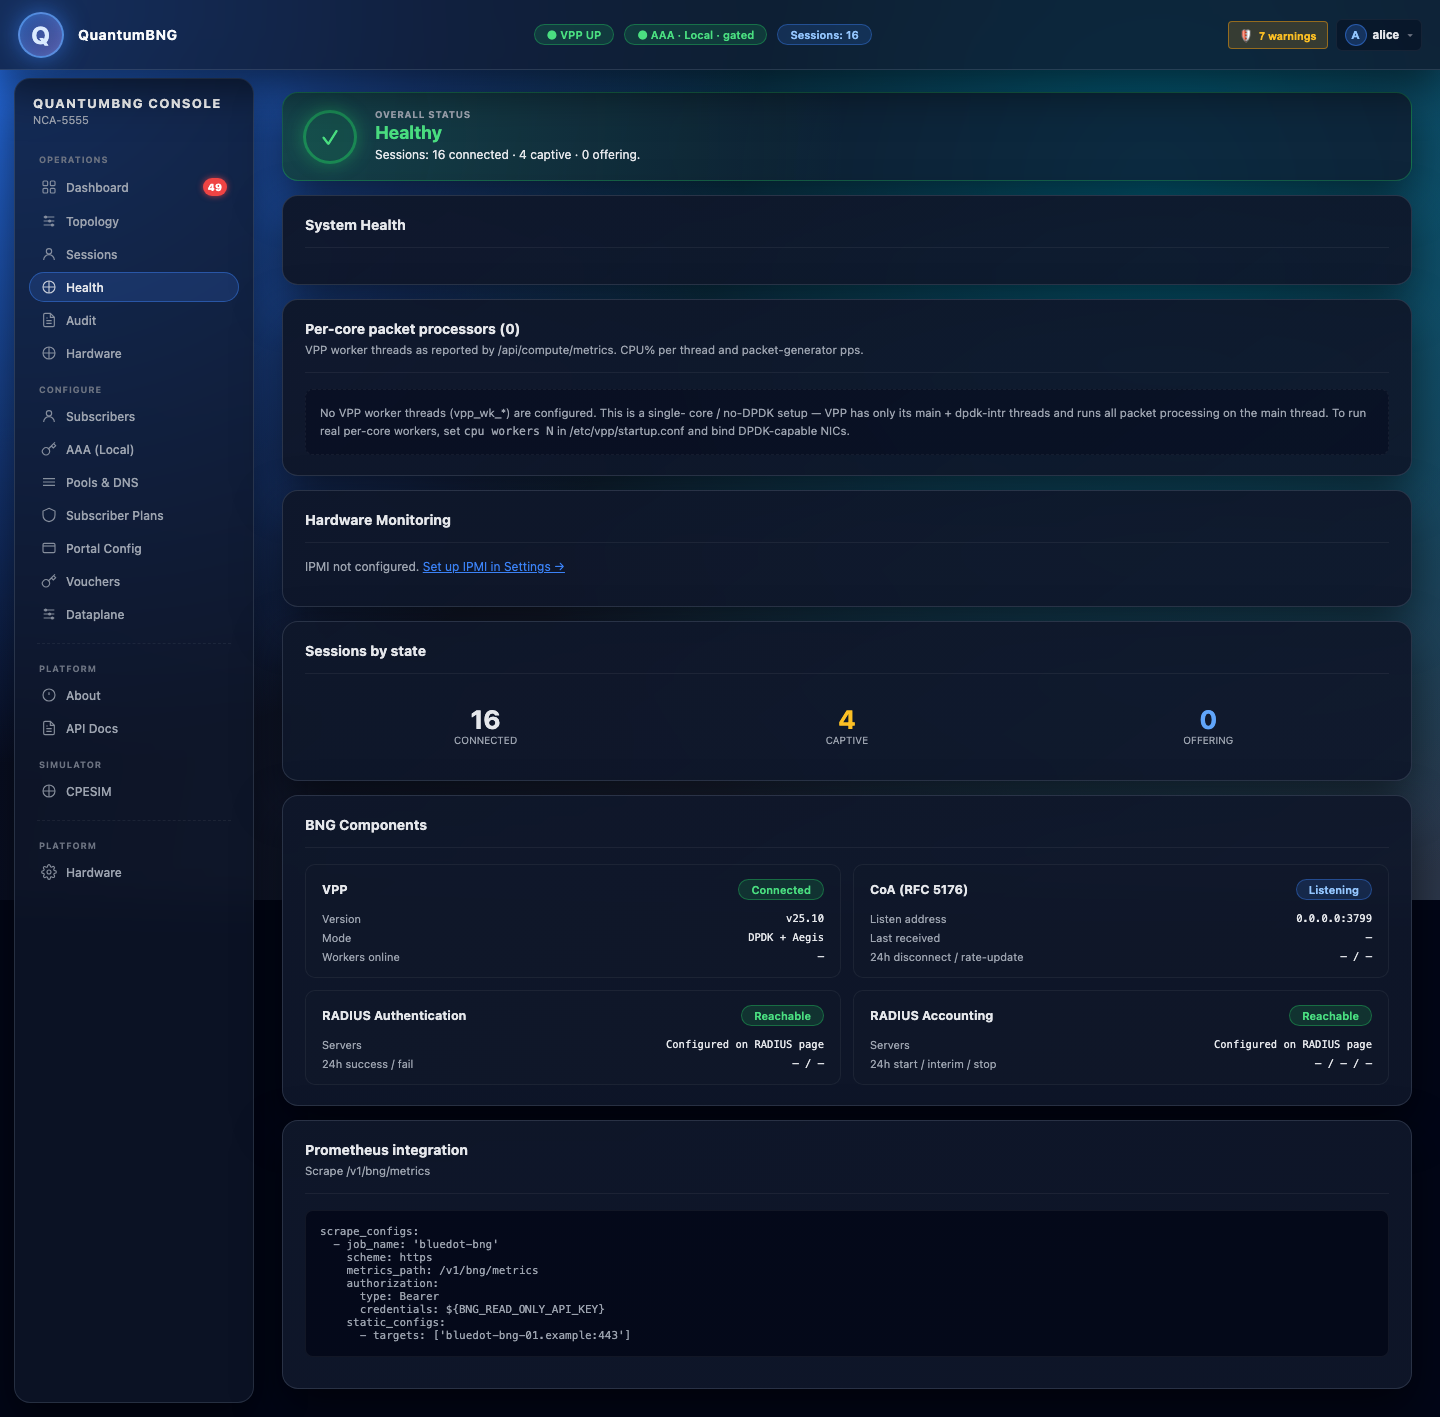
Checks include: TLS cert expiry, controller ↔ vpp-bridge connection, punt socket health, reply-path stall detector (see the memory note about tx_pps < rx_pps × 0.5 under load), snapshot store size, audit shipper backlog, AAA provider reachability.
Two sub-tabs: Health (checks) and Workers (VPP worker CPU utilization + per-worker packet counts — helpful to see if your corelist-workers sizing matches your traffic load).
Audit
Every operator action and every controller-observed event, correlated across three sources: QT audit log, controller API log, systemd journal.
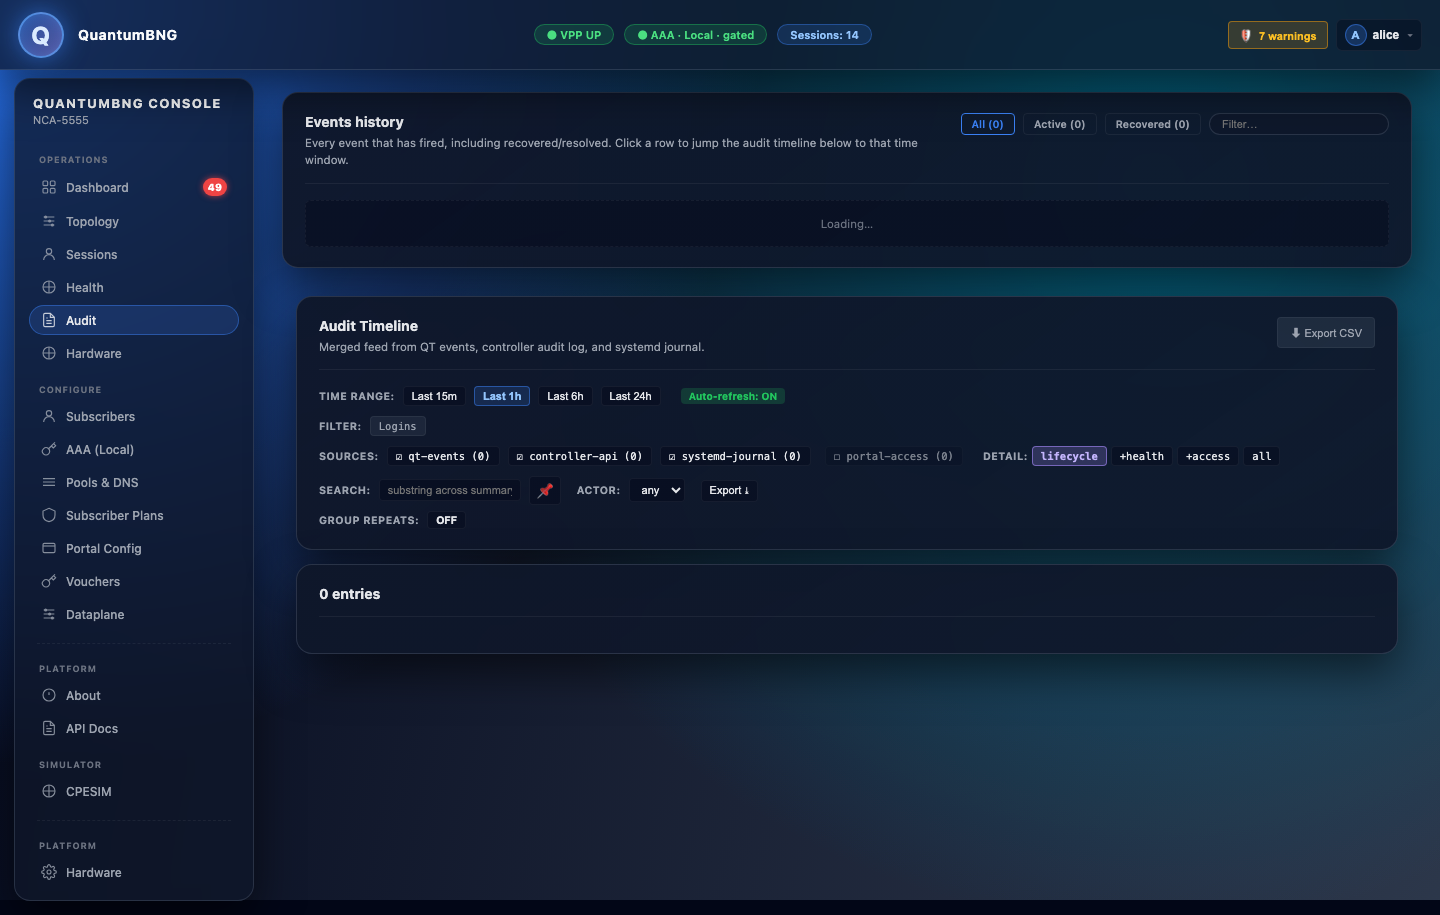
The timeline defaults to "live tail" — click Return to live if you scroll back. Each row includes:
- Timestamp + source (QT / Controller / Journal)
- Actor (username, API key ID, or
system) - Event kind + one-line description
- Rev-ID chip (linkable back to the source log line)
Use the date+time filters top-right to scope. Click Verbose journal to include noisy systemd events (default off).
Hardware / Compute
Hardware inventory (NICs, CPU, mem, disk) plus VPP CPU/worker mapping.
Use this page to sanity-check your box config before opening a support ticket: it shows exactly what VPP thinks it has (corelist-workers, hugepages, buffer allocations, per-worker queue placements) alongside what the kernel thinks it has (isolcpus, NUMA topology, IOMMU groups).
Subscribers
The provisioned-subscriber list (AAA source of truth). This is the roster of who's allowed to onboard; it's not the same as the Sessions list (which is who's currently online).
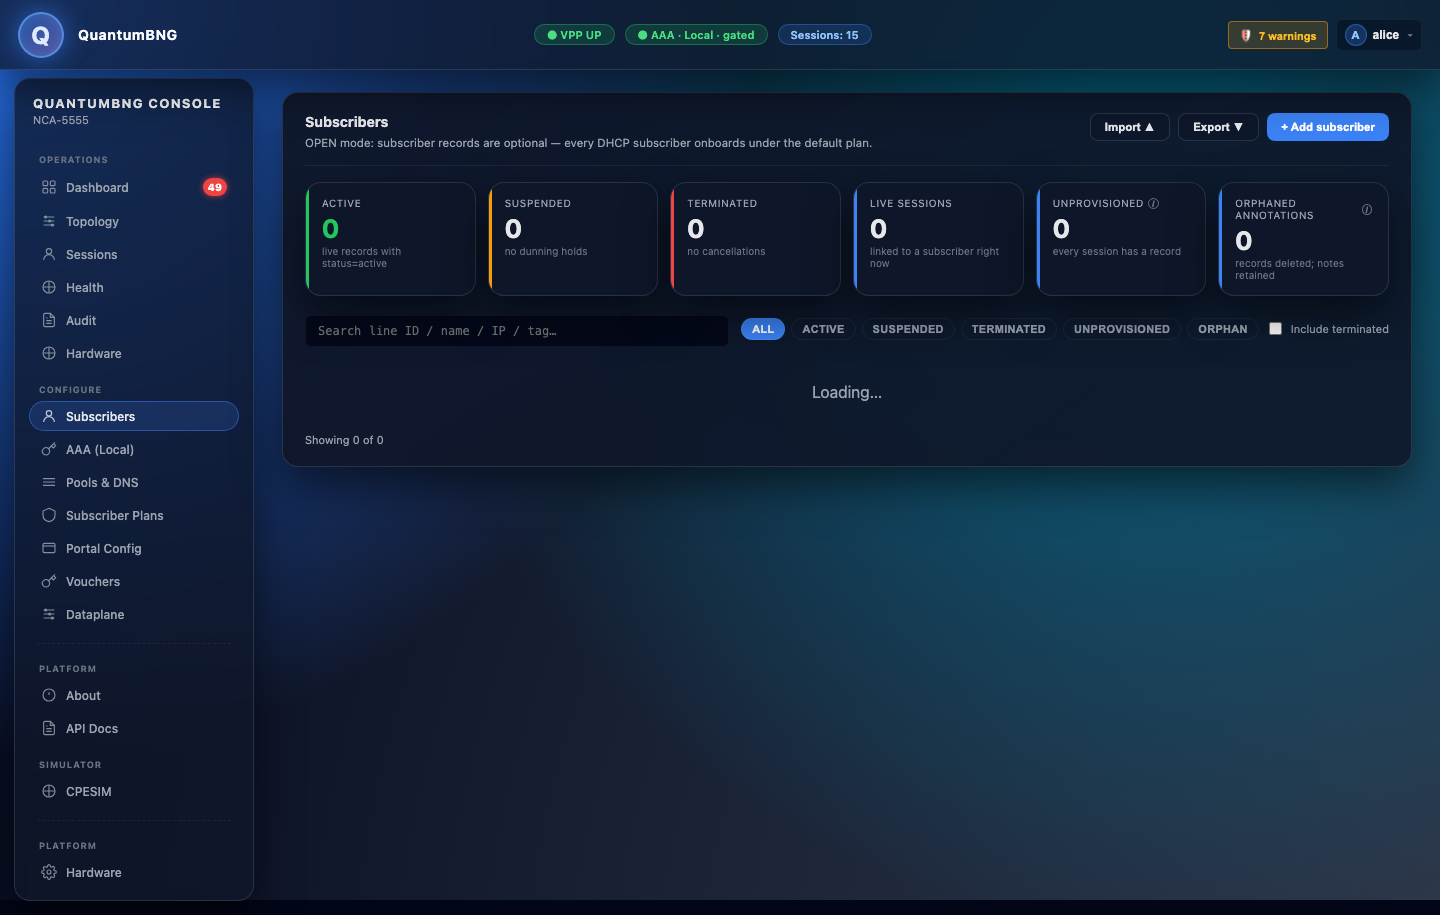
Columns: line identity (DHCP Option 82 circuit-id in hex), plan, status (active / suspended / terminated), lease-time overrides.
Add subscriber button top-right → single-form editor. For bulk import, use the Upload button and a CSV.
AAA (Local)
The local-AAA provider config. Two modes:
- Open — every DHCP DISCOVER is accepted, default plan assigned. Fine for lab / demo / small deployments where every connected device is trusted.
- Gated — only provisioned lines (see Subscribers) are accepted at plan. Unlisted lines get the
unknowndisposition (currentlycaptive→ portal, orreject→ NAK).
Change with care — flipping from Open to Gated on a running system silently kicks unprovisioned CPEs to captive.
Pools & DNS
The DHCP pools. Each pool has a name, a CIDR range, a lease time, and one or more DNS resolvers.
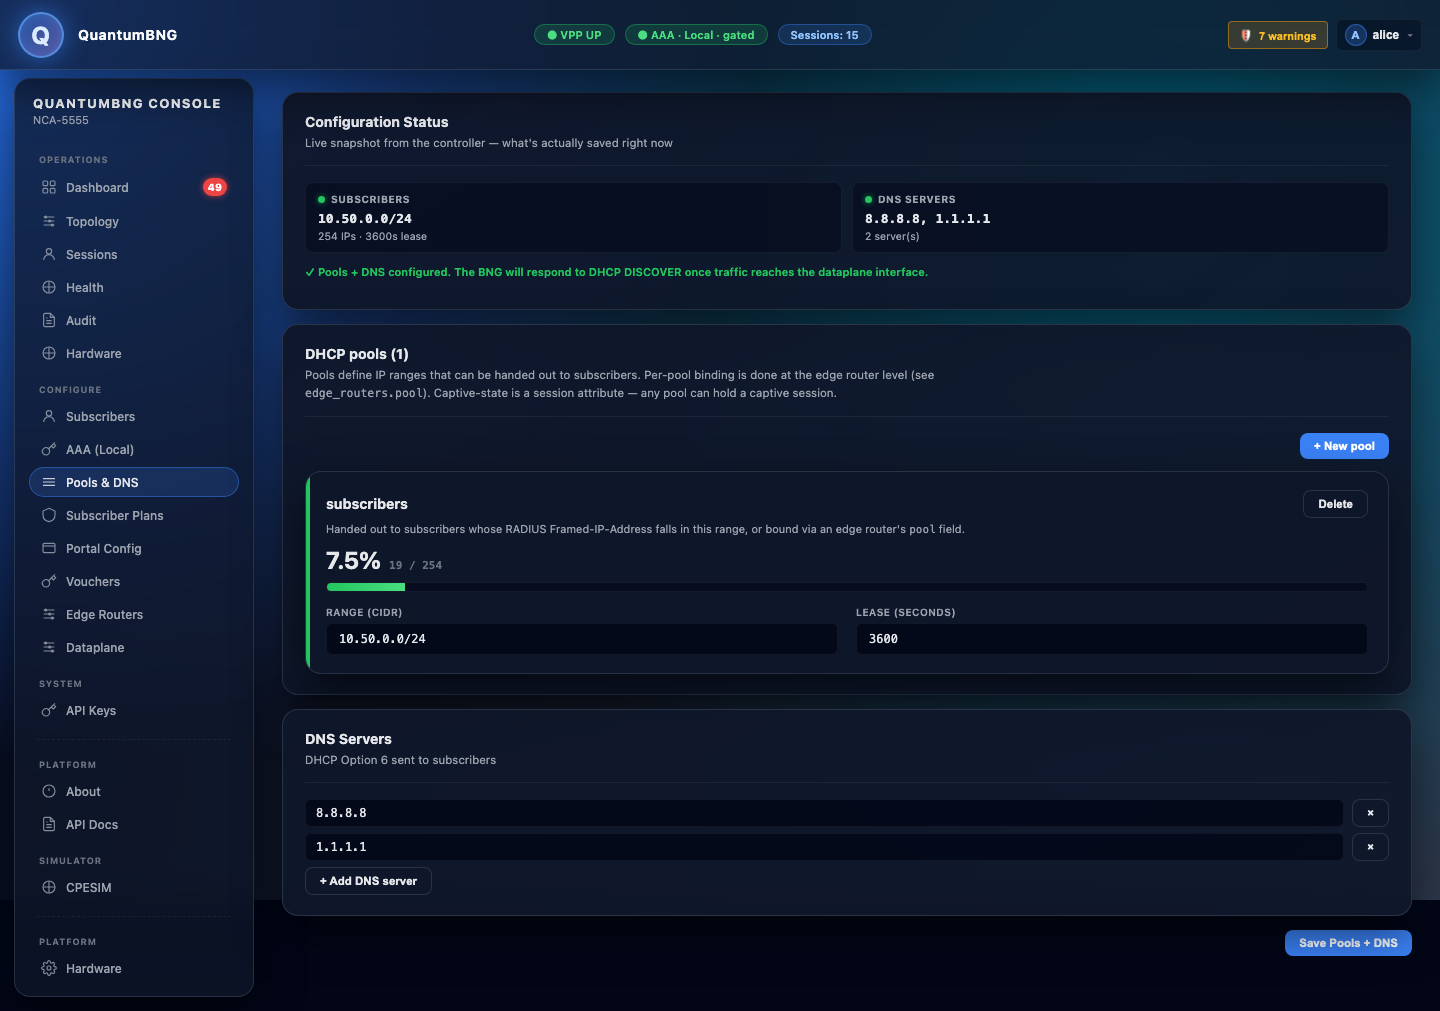
Default pool must exist — the setup wizard creates it. Add more pools if you need per-plan or per-geography allocation.
Pool utilization is shown as a horizontal bar with color-coded thresholds (amber at 80%, red at 95%). Alloc-failure counter shows how many DISCOVERs got NAK'd because the pool was exhausted.
Subscriber Plans
Rate plans — each defines up_cir_kbps, up_pir_kbps, dn_cir_kbps, dn_pir_kbps plus optional session/idle/interim timers.
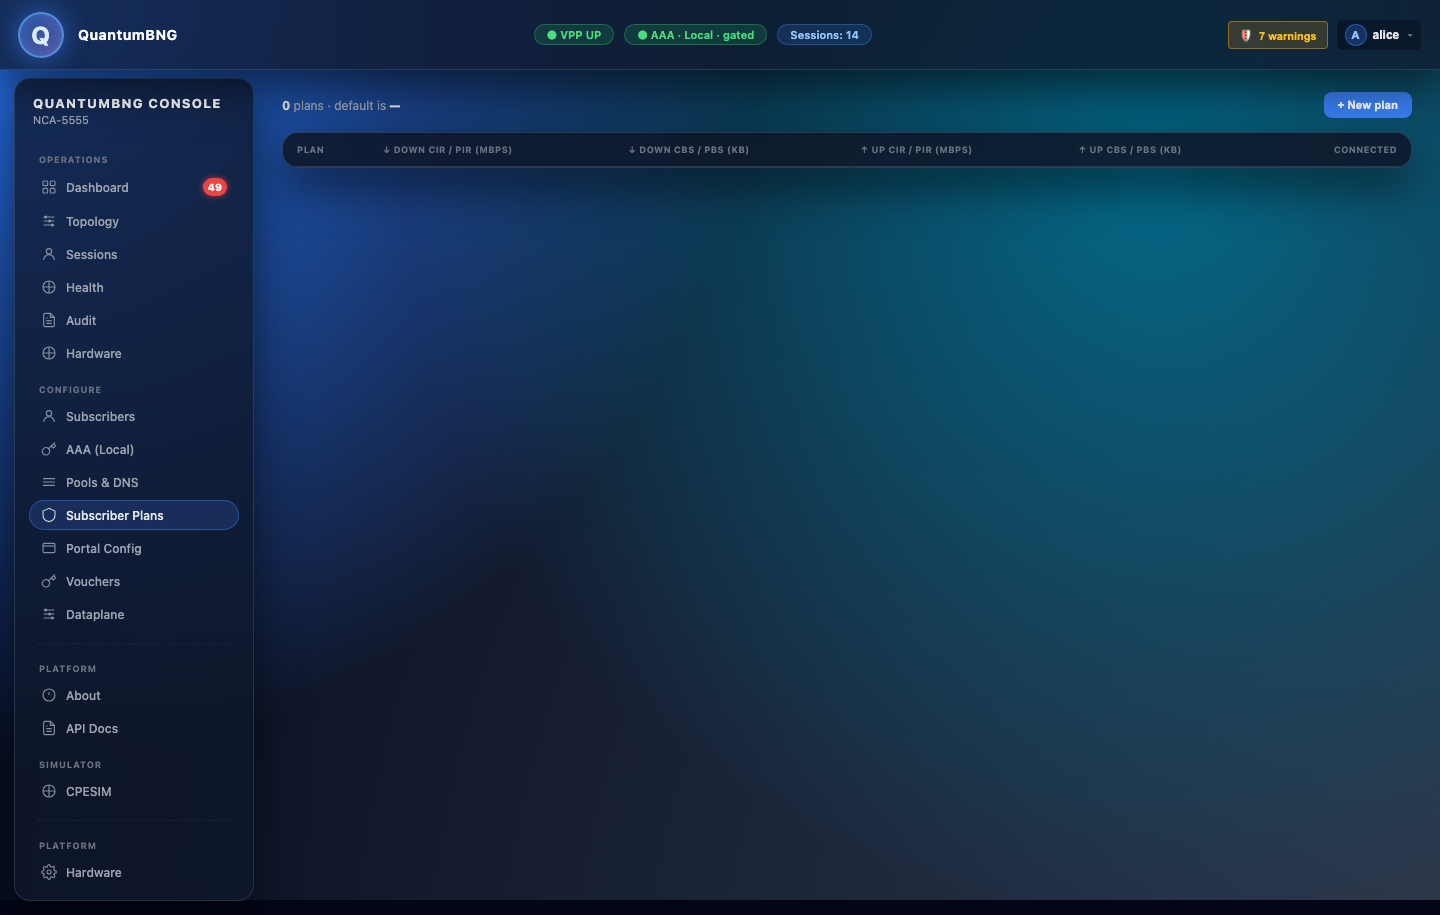
CIR = Committed Information Rate (guaranteed minimum, packets colored green). PIR = Peak Information Rate (burst ceiling, packets between CIR and PIR colored yellow). Packets above PIR are dropped (red).
*_bps fields in the API are BYTES per second. Multiply by 8 for bits/s (the webui shows Mbps).
Changes to a plan take effect on the next subscriber onboard OR when you click Re-rate active sessions to push the change immediately.
Portal Config
Captive portal setup — the portal_ip that the BNG hands to unprovisioned subscribers, the portal page's branding, and the vouchers page (if you use voucher-based auth instead of pure username/password).
If portal_ip is unset, unprovisioned DHCP DISCOVERs get silently dropped in gated mode. You'll see this in the controller log as captive required but no captive portal IP configured, dropping.
Dataplane
VPP-level knobs — interface state, RX/TX queue counts, RSS, worker placement, hugepage size, IOMMU groups.
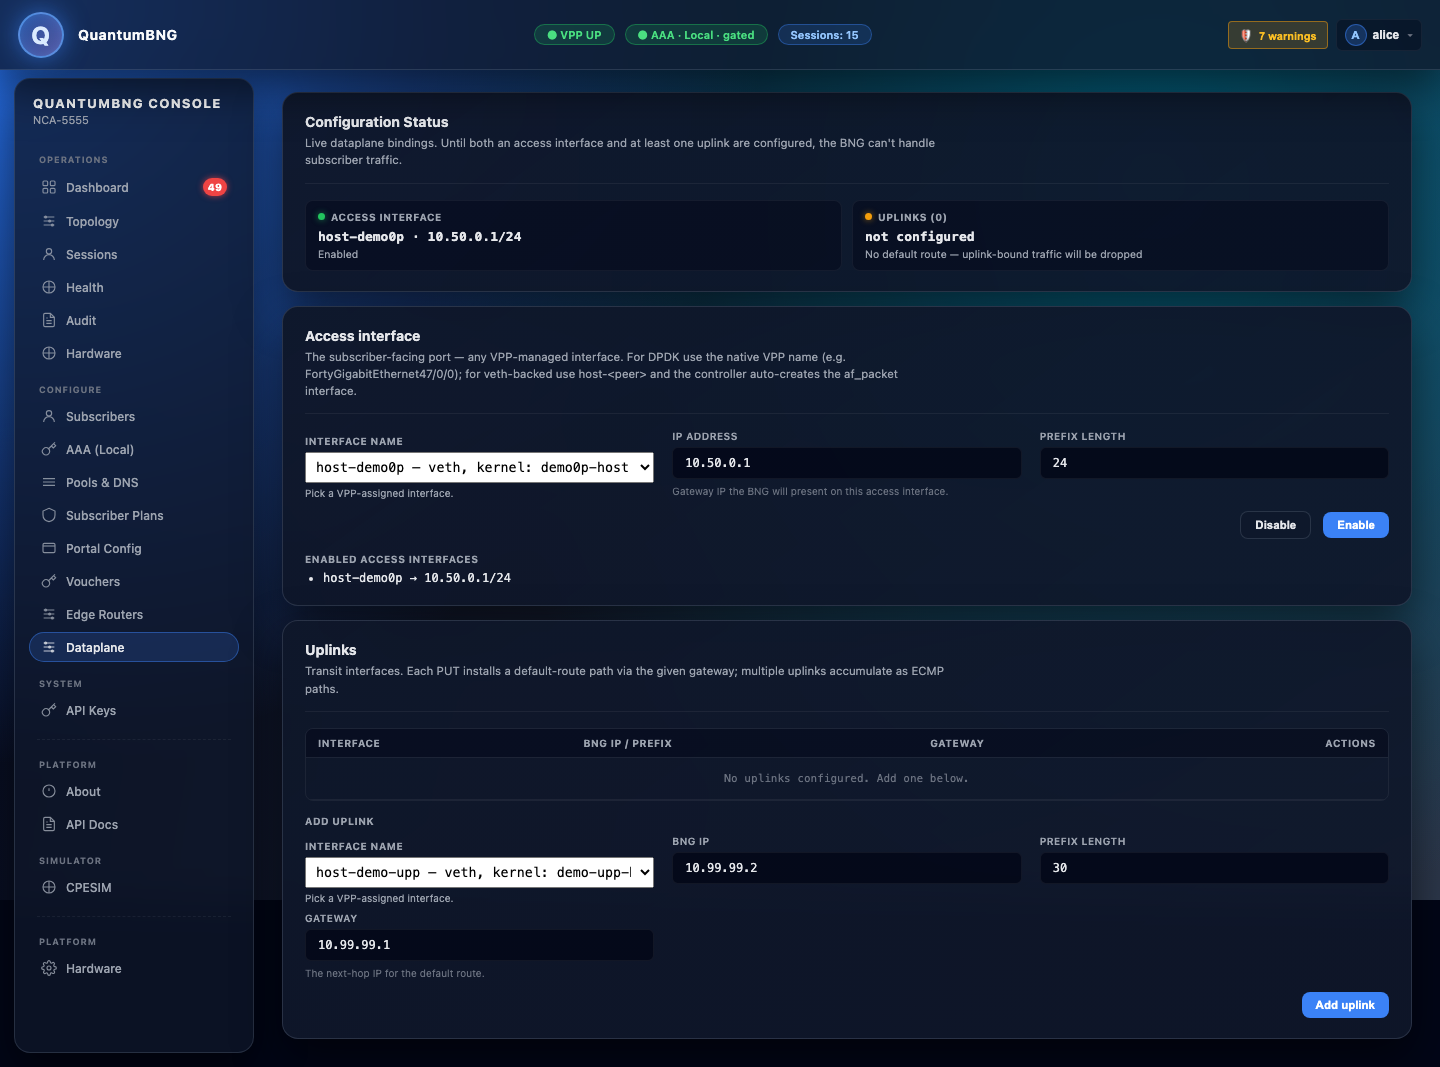
Most operators never touch this page — the wizard's defaults are correct for most single-NIC boxes. Edit if you're doing custom NUMA pinning, split-NIC access/uplink topologies, or dpdk driver overrides (e.g. vlan-strip).
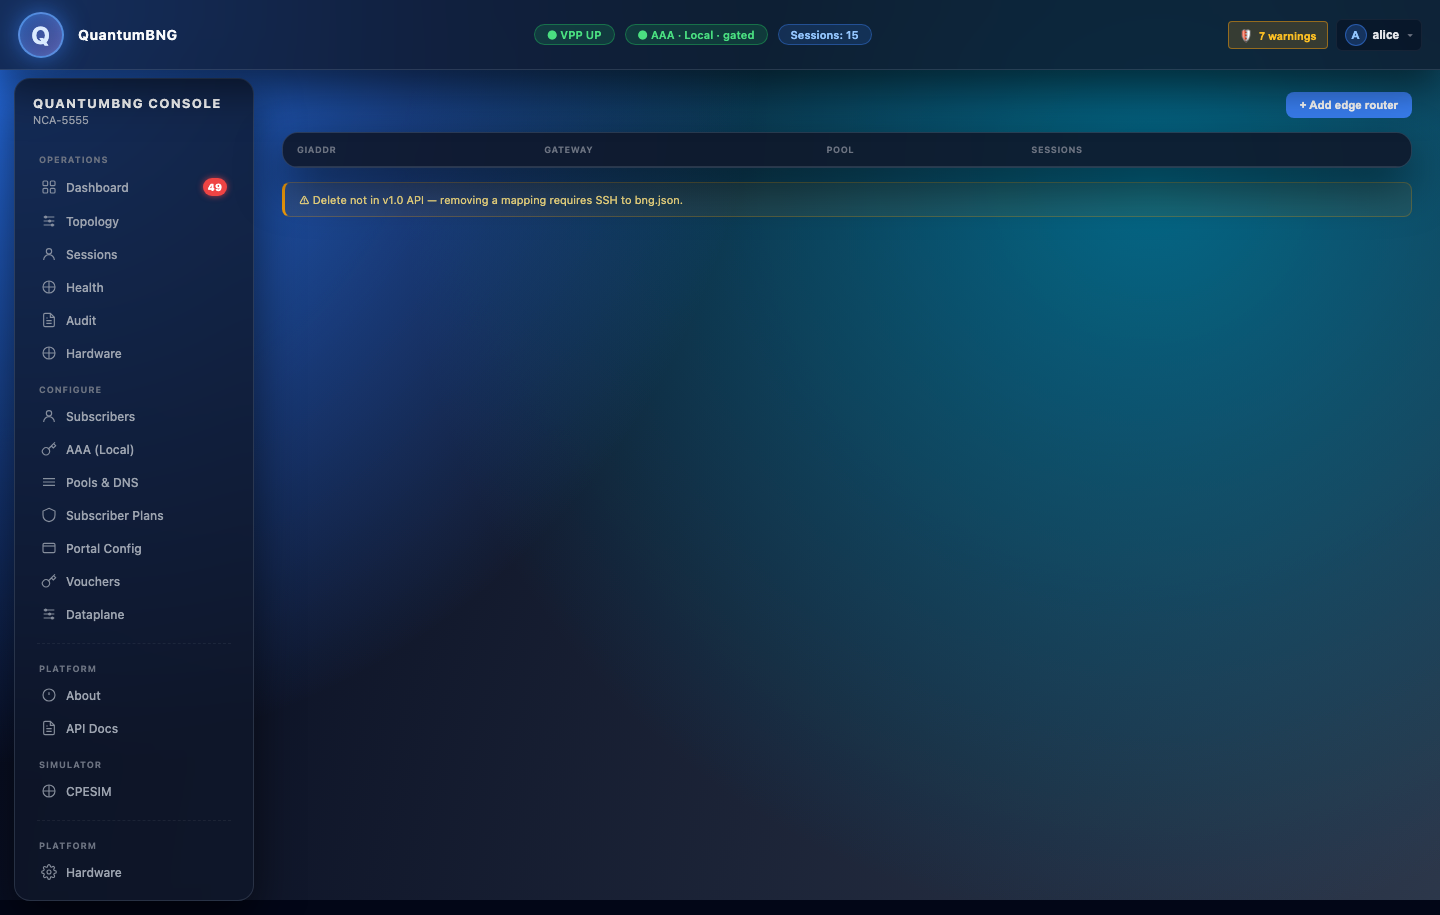
Edge Routers
For deployments where the BNG faces multiple edge routers (e.g., separate business/residential upstream), list them here with their public IPs and next-hop configs. The topology page uses this list to draw the WAN-side of the map.
About + Toybox
Version info + the Toybox plugin registry. Toybox is where operators install optional add-on modules — currently just CPESIM (the built-in subscriber simulator).
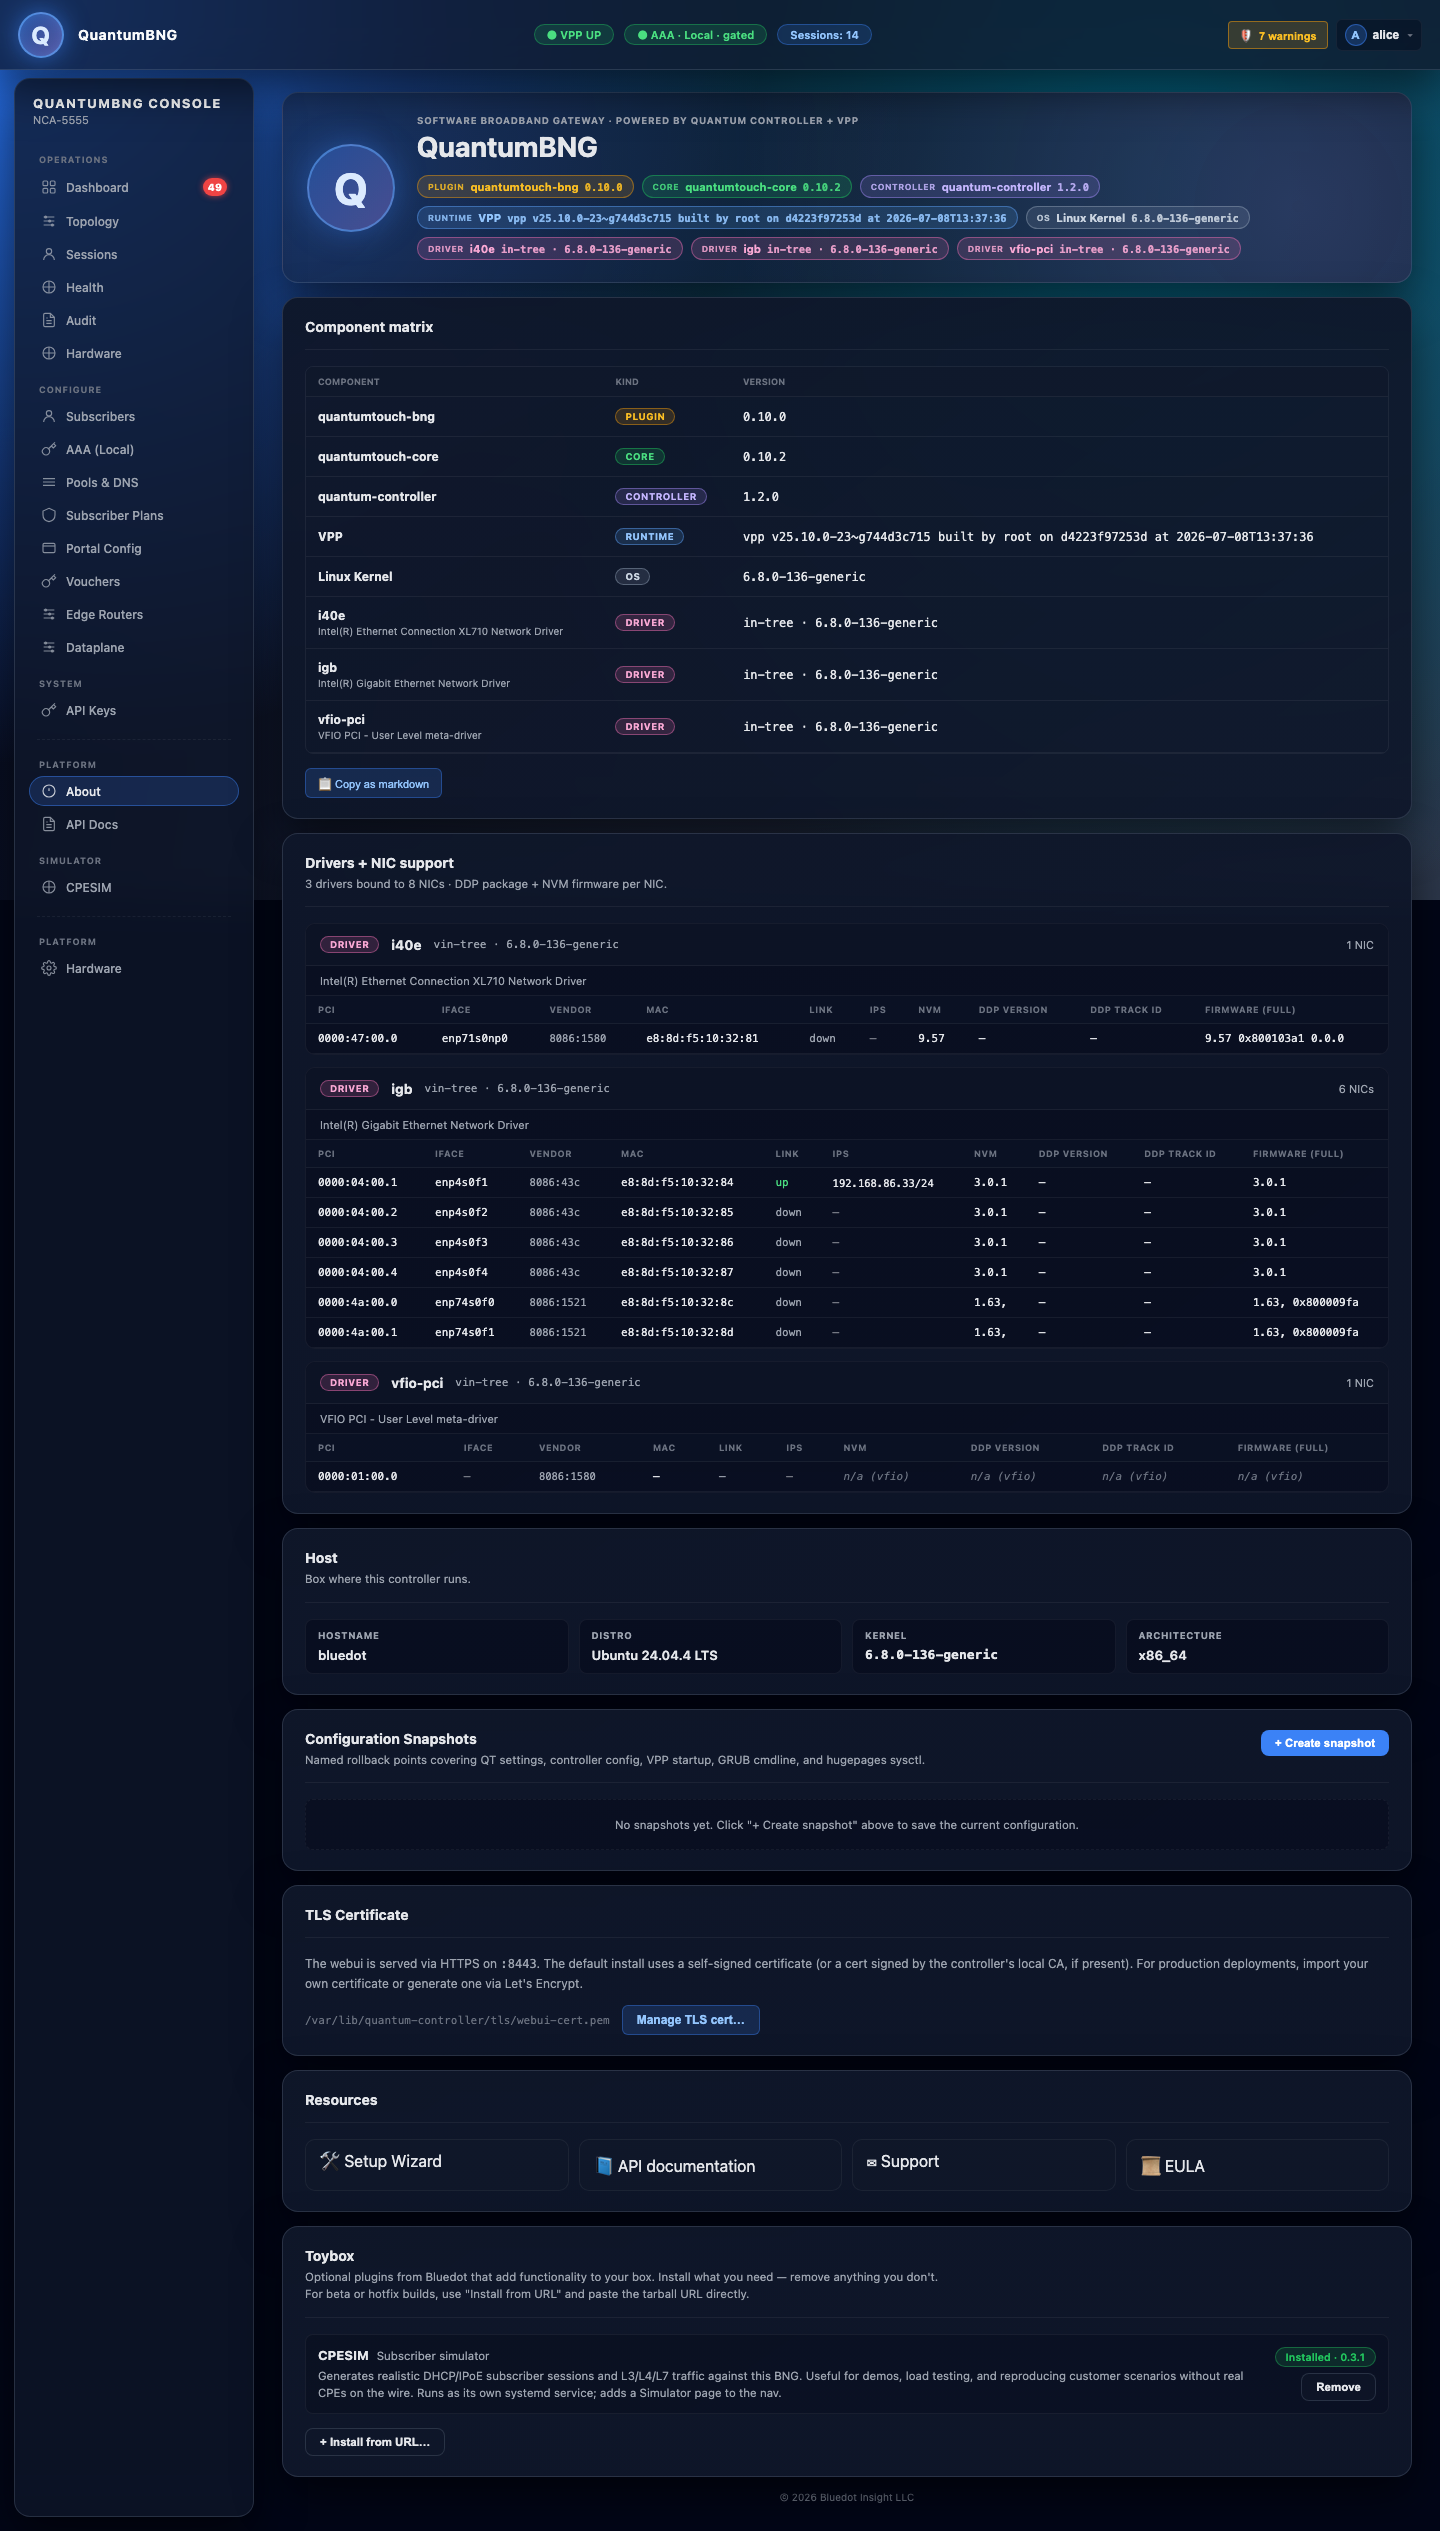
Each plugin row shows: install status, installed version, install/remove button. Install from URL lets you install a beta/hotfix build without waiting for a full BNG release.
API Keys
The webui's key store. Mint per-operator keys (recommended over sharing the bootstrap admin key), scope them to roles (read_only, read_write, admin_only, metrics_scraper), set expiry.
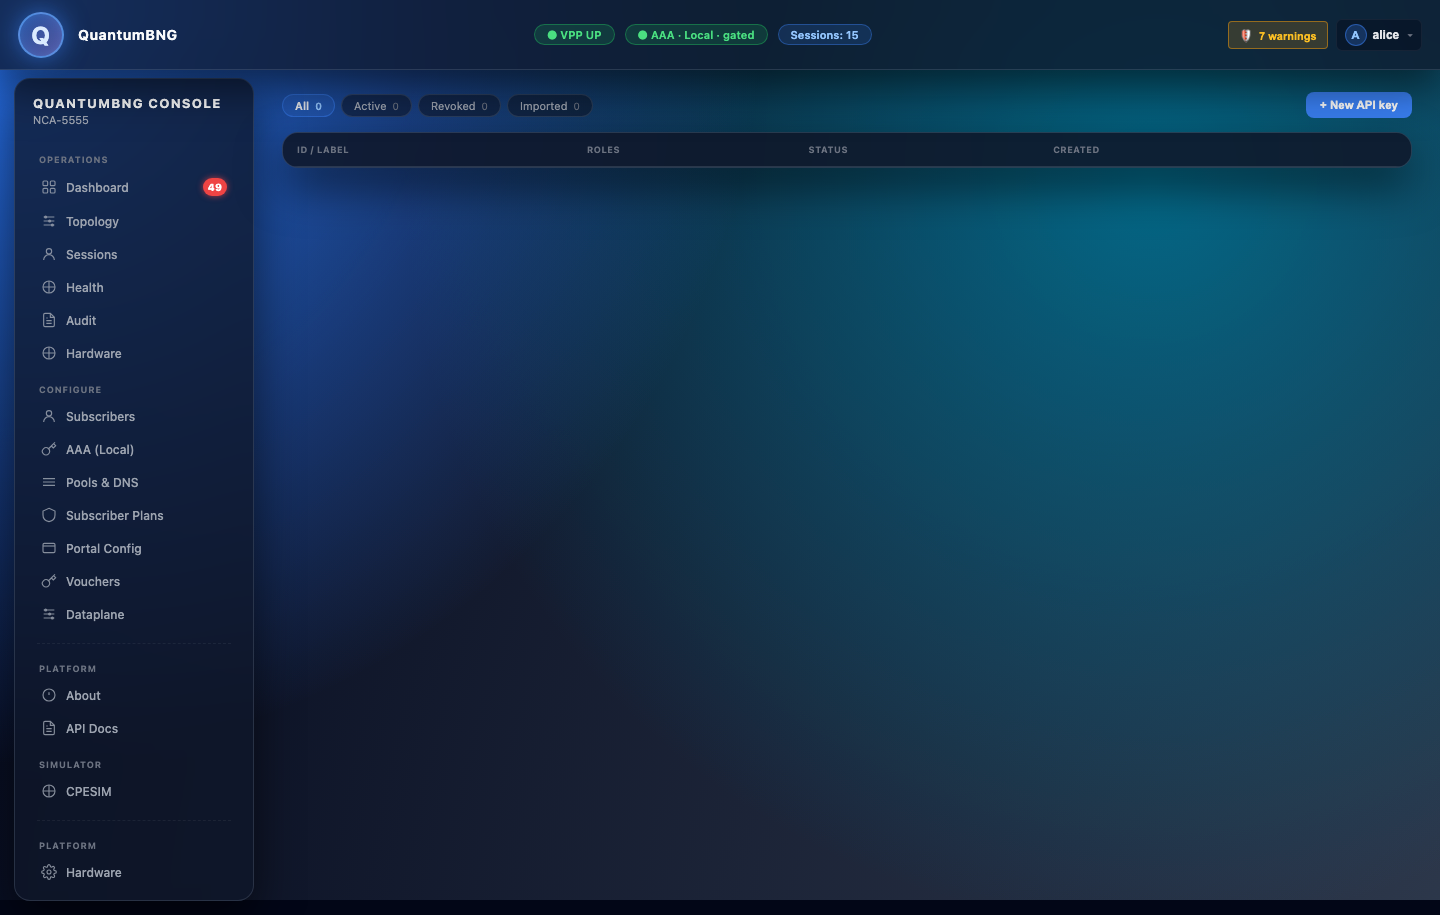
The metrics_scraper role is scoped to /metrics only and is what Prometheus uses. Rotate with sudo /opt/bng-deploy/bin/qt-scrape-token-rotate.
CPESIM
The subscriber simulator plugin's control page. Only visible if you installed CPESIM via Toybox.
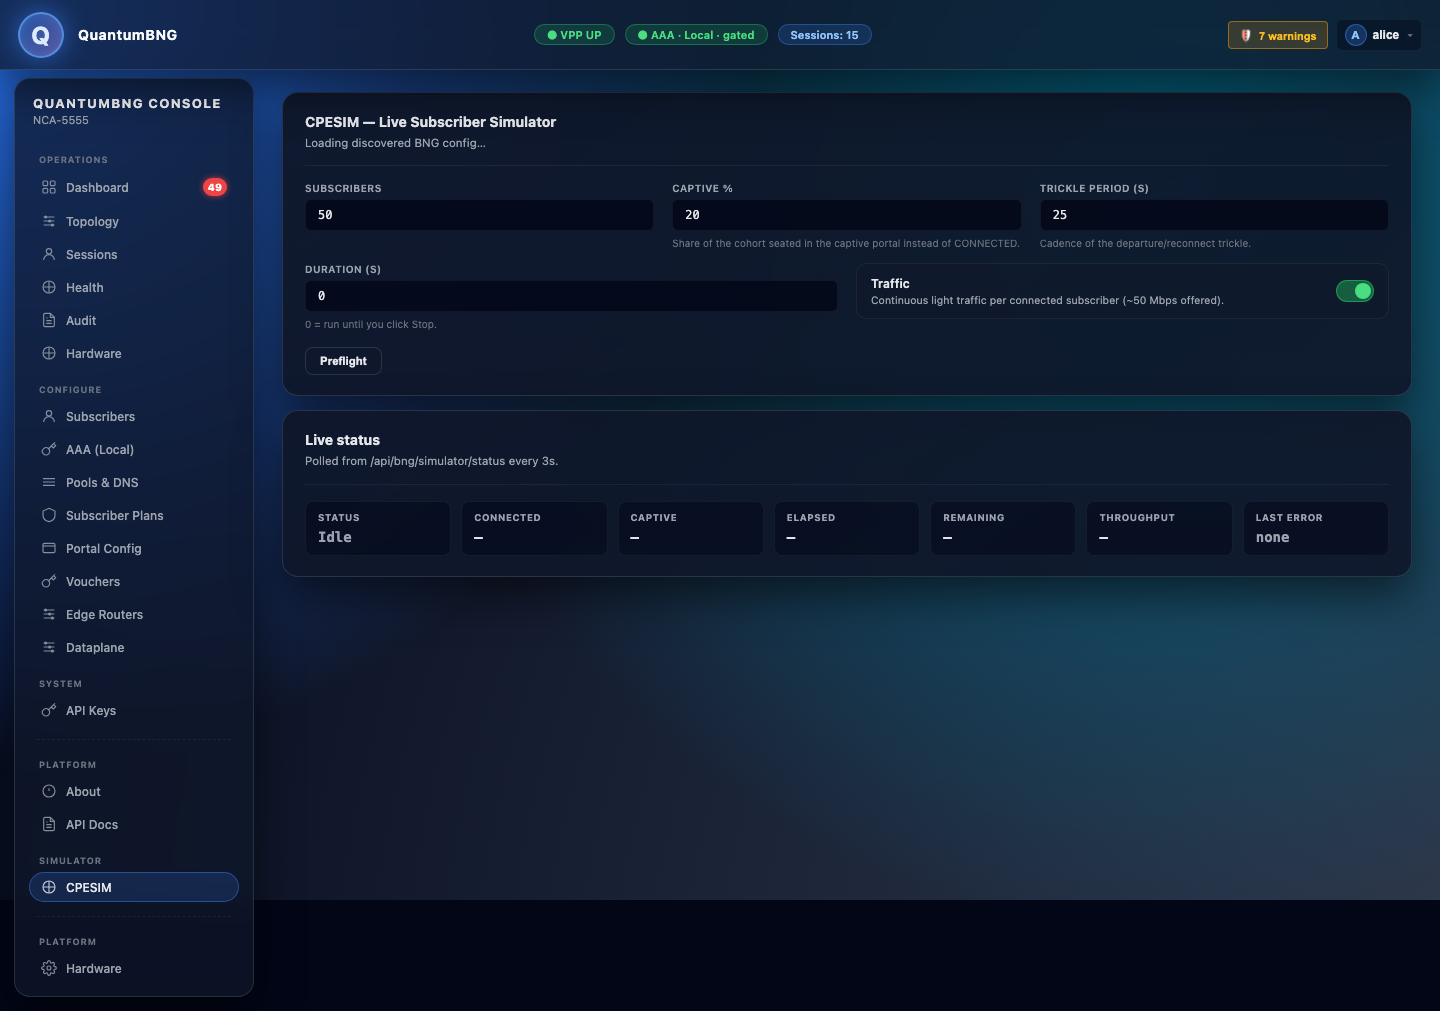
Start — spawn N simulated subscribers doing real DHCP + AAA + HTTP video traffic through your BNG. Stop — clean teardown. Reset simulator (admin-only) — recovery button that clears wedged state and restarts the whole CPESIM engine.
Configuration: subscribers count, captive fraction, duration. Sensible defaults are baked in — click Start and go.