
Step 7 — Run your first simulated subscribers
Click the new Simulator entry in the left nav. You land on a configuration page with three main knobs:
| Setting | Recommended | What it does |
|---|---|---|
| Subscriber count | 10 | How many simulated CPEs to spin up |
| Captive-portal ratio | 20% | Fraction of subscribers that arrive without RADIUS auth and get redirected to the walled-garden portal |
| Downstream traffic | On | Whether authenticated subscribers pull a large file (drives real bandwidth counters) |
Ten subscribers is a good starting point on a laptop — enough to see both the authenticated flow and the walled-garden portal flow in action, small enough not to tax the host. You can bump this later once you know the box handles it. Click Start.
What happens next, in order:
- T+0s — CPESIM creates 10 veth pairs inside a dedicated network namespace, attaches them to
veth-access-vppon the VPP side, and sends DHCPDISCOVERframes from each simulated MAC. - T+2s — The BNG's control plane processes each DISCOVER, offers a
100.64.0.xlease, sees theREQUEST, sendsACK, and creates a subscriber session. Subscribers appear on the Subscribers page one by one. - T+5-10s — 8 authenticated subscribers (the 80% non-captive ones) start pulling a ~2 GB test file. Downstream throughput on the Dashboard climbs from zero to around 200 Mbps.
- T+15-20s — 2 captive-portal subscribers (the 20% captive ones) hit the walled-garden redirect and get held in a
CAPTIVE_PENDINGstate. They show up on the dashboard but push no data-plane traffic. - T+30s — steady state. All 10 subscribers online, all in the state they'll stay in until you stop the simulator.
Flip to Subscribers in the left nav and you can watch the fleet appear one row at a time as DHCP finishes for each simulated CPE:
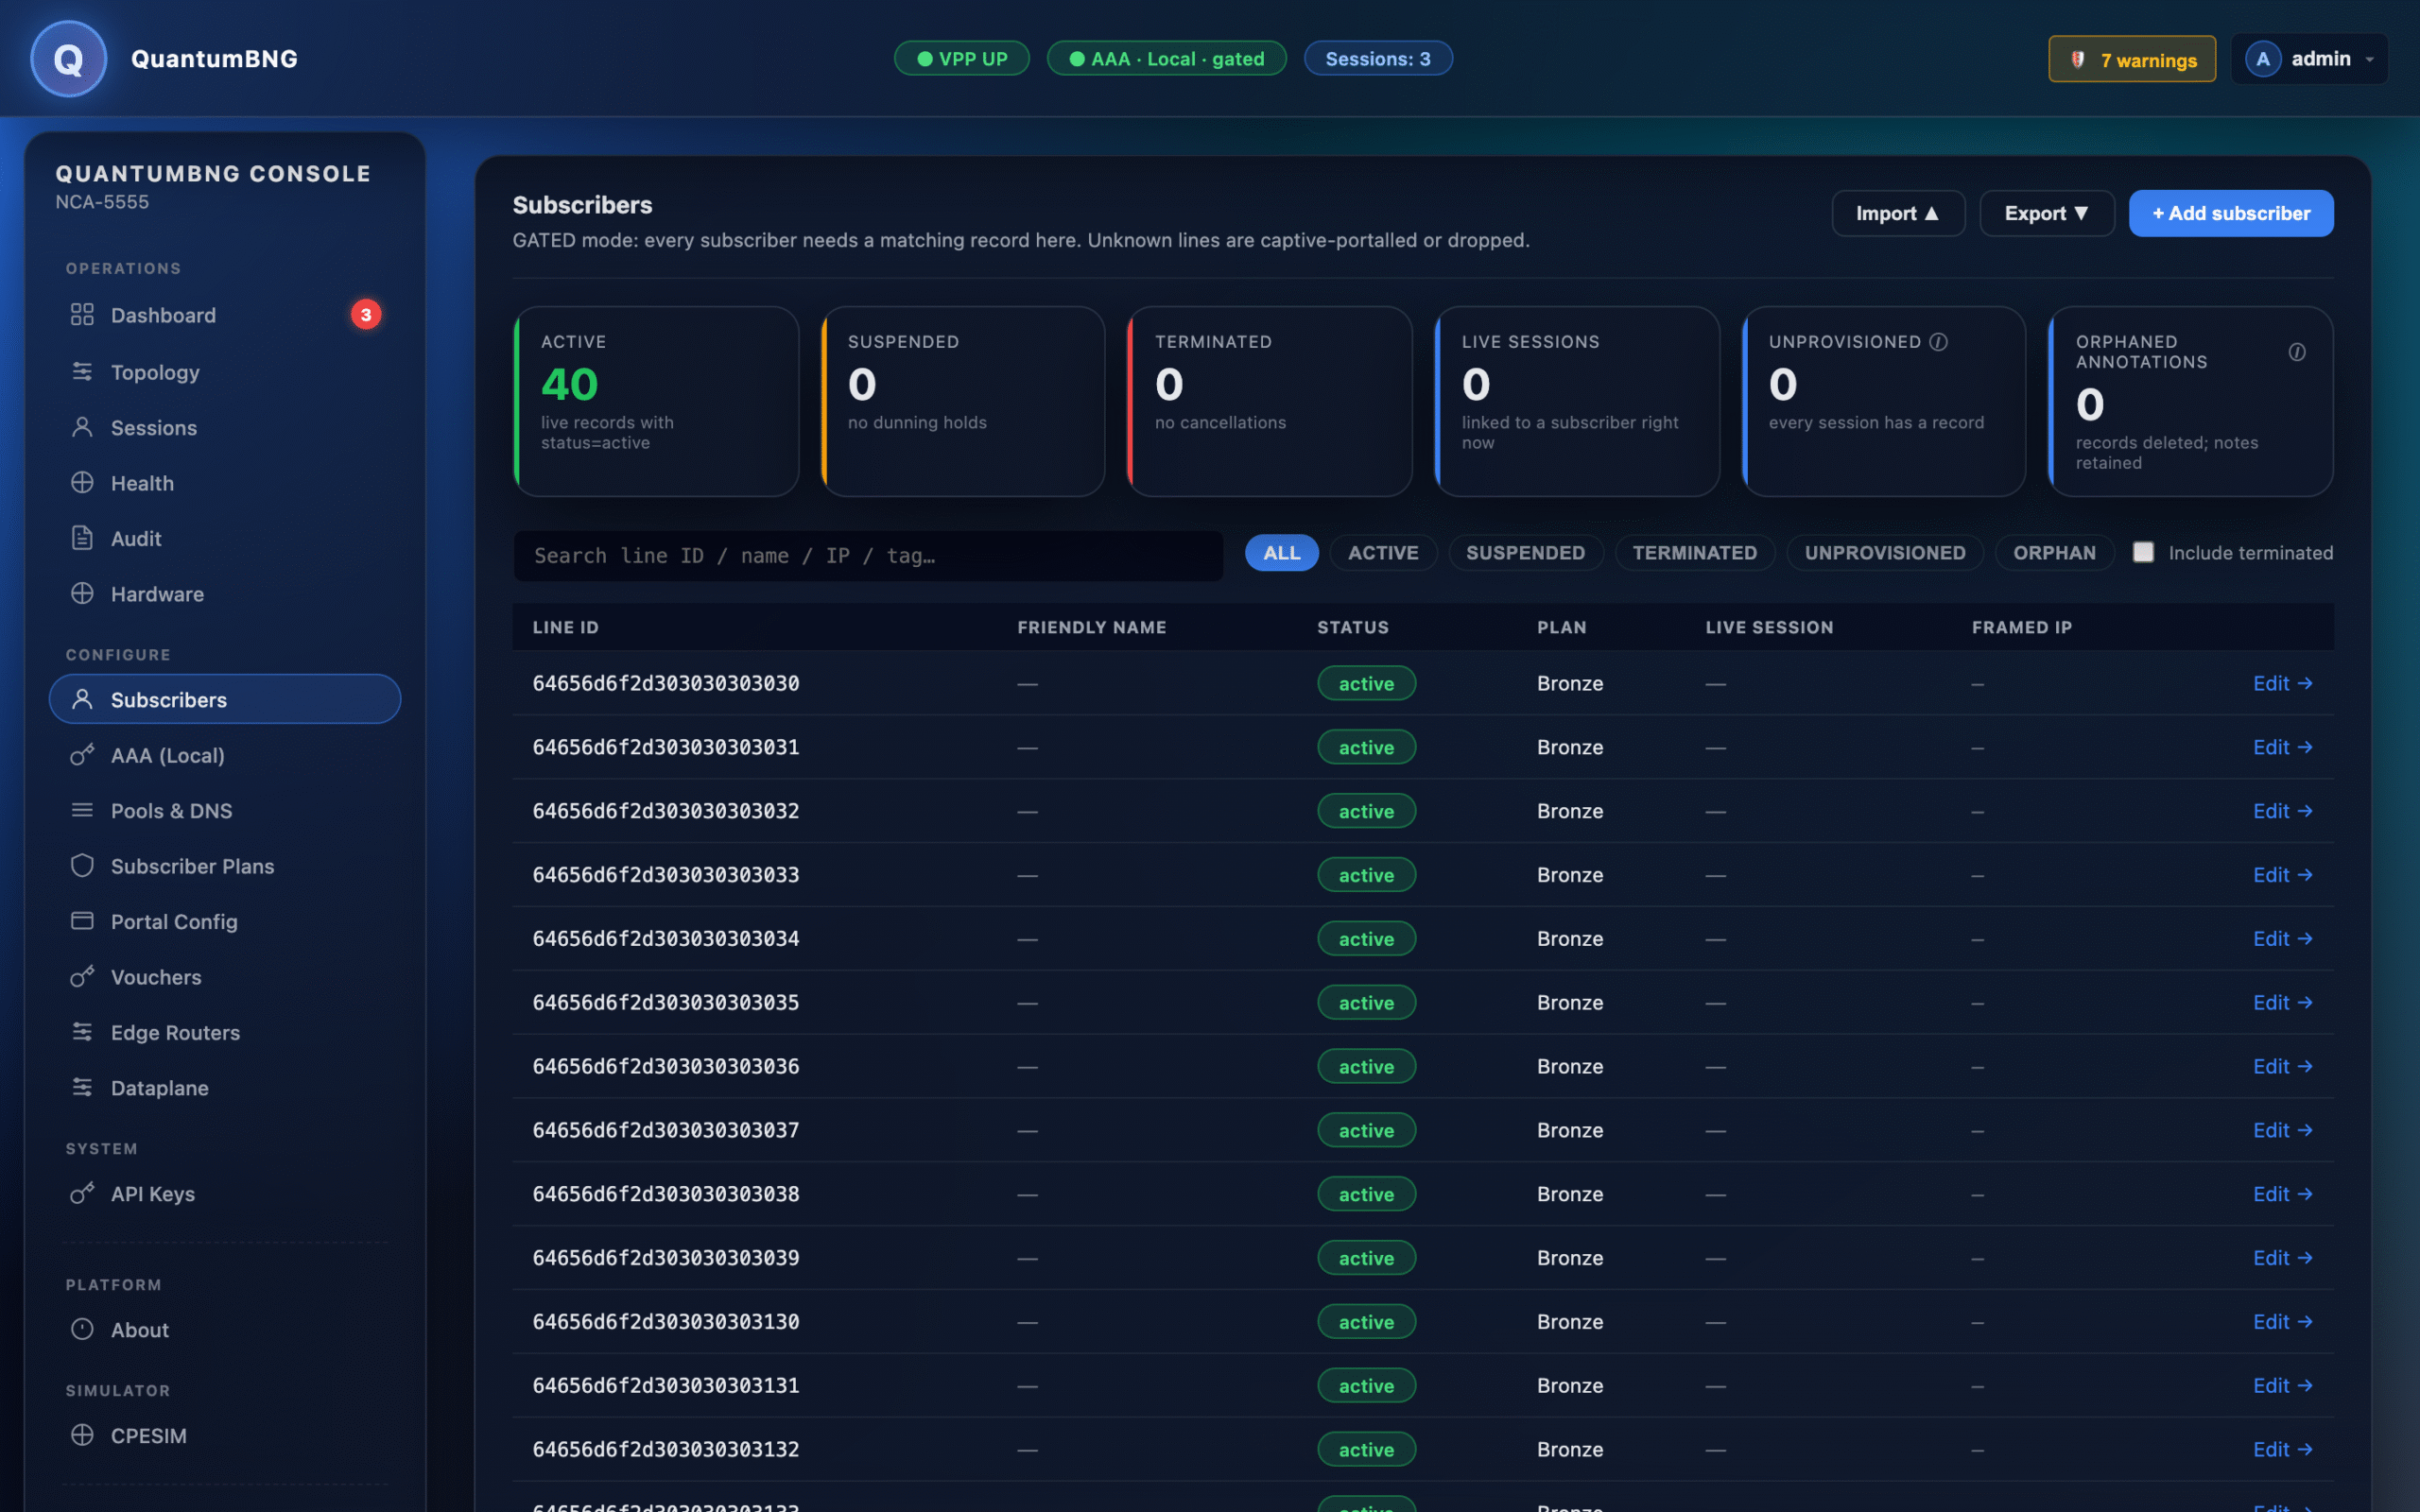
Flip to Dashboard and you should see: aggregate downstream hovering around 200 Mbps (the plan's PIR × 8 authenticated subscribers = 25 Mbps × 8), and per-plan meter charts showing green / yellow / red bands.