
QuantumBNG Operator Guide
Audience: the operator running QuantumBNG day-to-day.
Complements: quick-start.md for first-time install; this document is the reference for everything after.
What QuantumBNG is
A self-contained Broadband Network Gateway for small and mid-size ISPs. One box takes DHCP requests from subscriber CPEs, provisions IPs from your pool, enforces per-plan rate limits at line rate via a 3-color policer, and forwards subscriber traffic to your upstream router.
One tarball, one sudo ./install.sh, one web UI at https://<box>:8443. No separate controller box, no separate database, no separate telemetry stack — everything lives on the appliance and starts on boot.
Architecture at a glance
| Plane | Component | What it does | Where it lives |
|---|---|---|---|
| Management | QuantumTouch (bng-deploy) | The web UI + REST API operators use. Flask + gunicorn. | Port 8443 (HTTPS) |
| Control | Quantum Controller | Source of truth for subscribers, sessions, DHCP leases, AAA state. | Docker container, port 3000 (HTTPS, 127.0.0.1 only) |
| Data | VPP + tuned DPDK | Line-rate packet forwarding with a per-subscriber 3-color policer (trTCM). | Kernel-adjacent, one main core + N workers pinned to isolcpus |
| Bridge | vpp-bridge | Go daemon that translates controller decisions into VPP CLI operations and vice versa. | systemd unit |
Traffic path for a subscriber packet:
CPE  →  Access NIC (VPP)  →  BNG plugin (policer + session lookup)  →  Uplink NIC (VPP)  →  Core router
                                    ↑
                                    Controller (via vpp-bridge) — session install, plan lookup
DHCP path:
CPE DHCP DISCOVER → Access NIC (VPP) → BNG plugin punts → vpp-bridge → Controller
                                                                            ↓
                                                                        AAA lookup (Local or RADIUS)
                                                                            ↓
Controller crafts OFFER → back down the stack → CPE
The free tier caps concurrent sessions at 1,000. That's shown in the header pill, in the
Sessions "over time" chart, and on the dashboard's session-capacity indicator.
A signed capacity licence raises the cap to a per-customer limit and applies
immediately on activation — no restart. Licensing gates capacity only, never function: a
missing, expired or tampered licence reverts to the free-tier cap rather than blocking
operation. See Licensing for the activation flow.
For a deeper theory-of-operation (packet path, state ownership, DHCP/AAA state machines), see ../theory-of-operation.md — that document is for engineers integrating against QuantumBNG; this one is for operators running it.
The console
You reach it at https://<box-ip>:8443. First-run brings you to the setup wizard (see the Quick Start). After that, you land on Dashboard.
The left nav is grouped into four sections:
| Group | Purpose |
|---|---|
| OPERATIONS | What's happening right now — live counters, sessions, health, audit trail |
| CONFIGURE | The knobs — pools, plans, subscribers, portal, dataplane |
| PLATFORM | About page, hardware inventory |
| SIMULATOR | CPESIM (only visible if the CPESIM plugin is installed) |
Header pills are the always-on status snapshot. Green = OK, amber = warning, red = action needed:
- VPP — dataplane up? If
?for more than 10s, the controller can't reach vpp-bridge (see Troubleshooting). - AAA · Local · gated (or
open) — provider health + mode.Local · unreachablemeans the local AAA store isn't loading. - Sessions: N — current onboarded subscriber count.
- N warnings (amber shield) — click to see open events (unread events also show as a badge next to Dashboard in the nav).
Dashboard
The operator's home screen. Six top-line KPIs plus two live throughput charts and three panels.
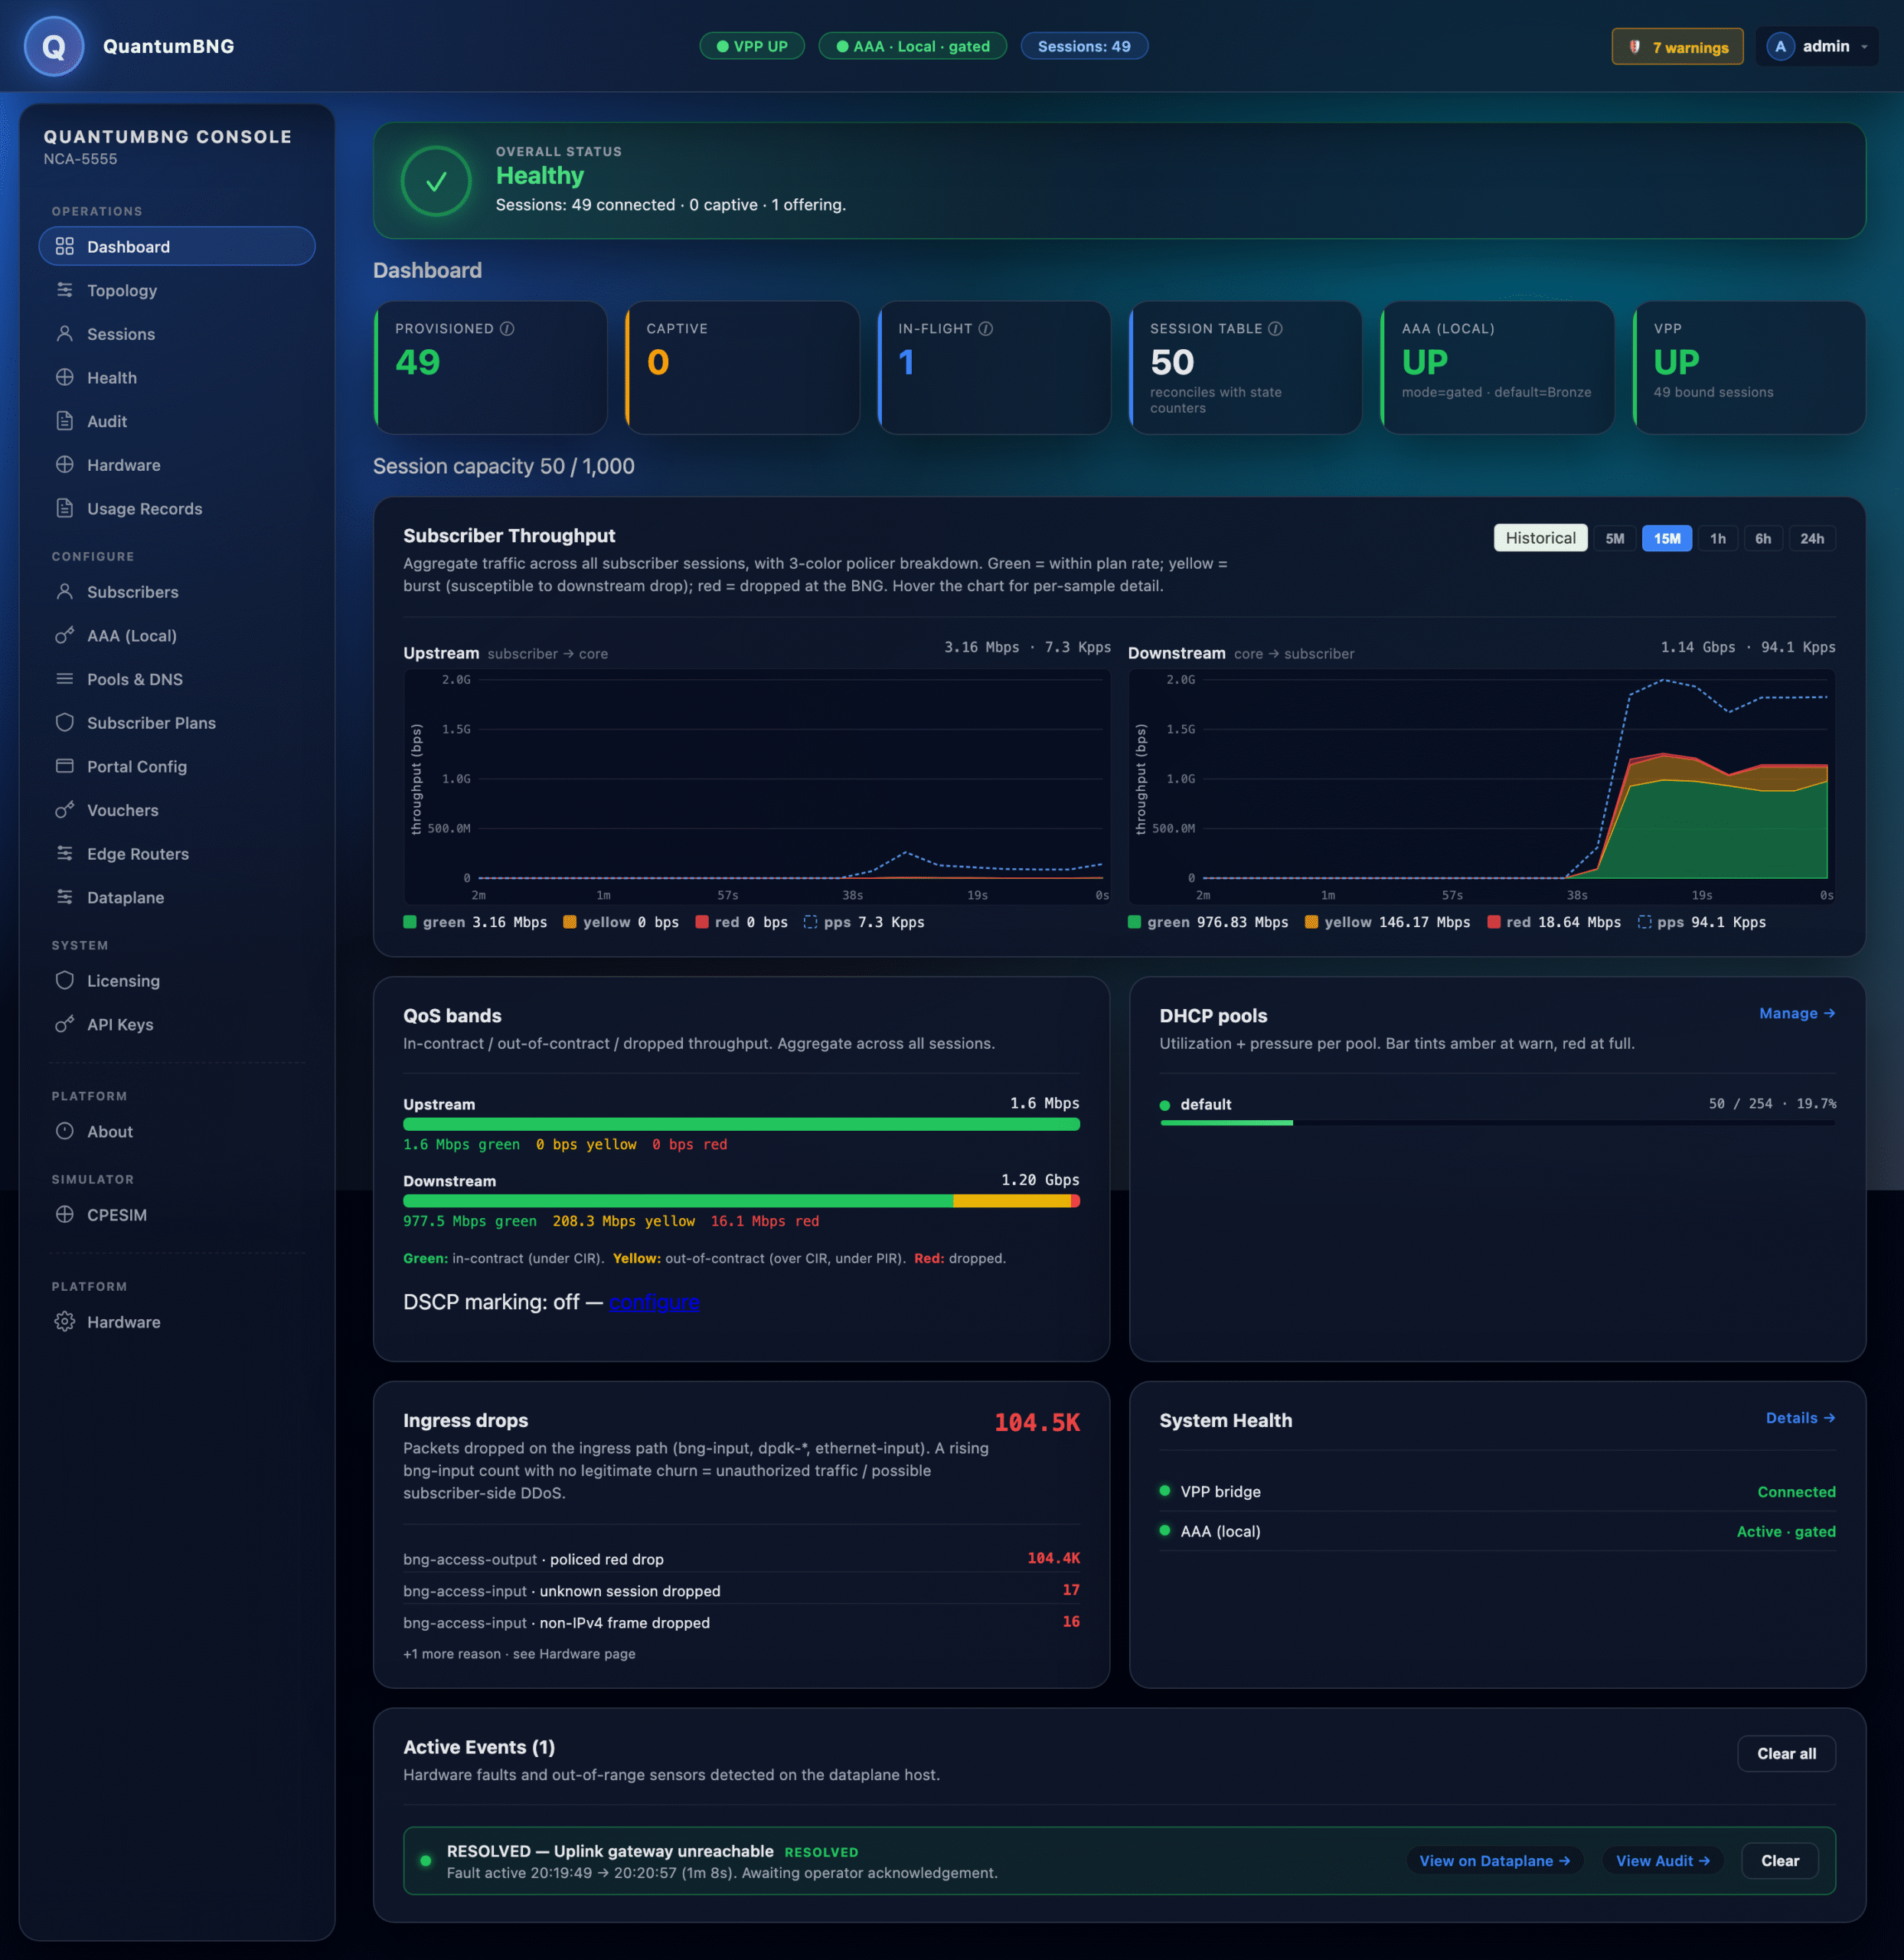
KPIs (top row, left to right):
| KPI | What it means | When to look |
|---|---|---|
| Provisioned | Subscribers currently CONNECTED (have an IP, on their plan) | Baseline health |
| Captive | Subscribers redirected to portal (unprovisioned or awaiting login) | Rising during business hours = provisioning workflow lag |
| In-flight | Sessions mid-DORA (OFFERING or REQUESTING) | > 10 for more than 30s = reply-path stall |
| Session Table | VPP-side session-slot occupancy | Approaches 1000 = at Community Edition cap |
| AAA (Local) | Local AAA provider health | DOWN = users can't authenticate (see AAA (Local)) |
| VPP | Dataplane status + bound-session count | UP N bound sessions — should match Provisioned KPI |
Subscriber Throughput — two stacked-area charts, upstream and downstream. Each shows the 3-color QoS breakdown: green = within CIR (in-contract), yellow = between CIR and PIR (burst), red = dropped by the policer. Time-range picker top-right (5M / 15M / 1H / 6H / 24H).
QoS bands — same three colors as the throughput chart but as a rolling-average bar per direction. Use the throughput chart to see when a spike happened; use the bands to see the current split.
DHCP pools — per-pool utilization bar. Tints amber at warn threshold, red at full. Click Manage to jump to Pools & DNS.
Ingress drops — a counter of packets dropped on the ingress path (bng-input, dpdk-*, ethernet-input). A rising count with no legitimate churn typically means unauthorized traffic or subscriber-side DDoS.
System Health — one-liner status of each subsystem. Click Details for the full Health page.
Topology
Live map of every element in the packet path — from CPEs on the left to the core router on the right.
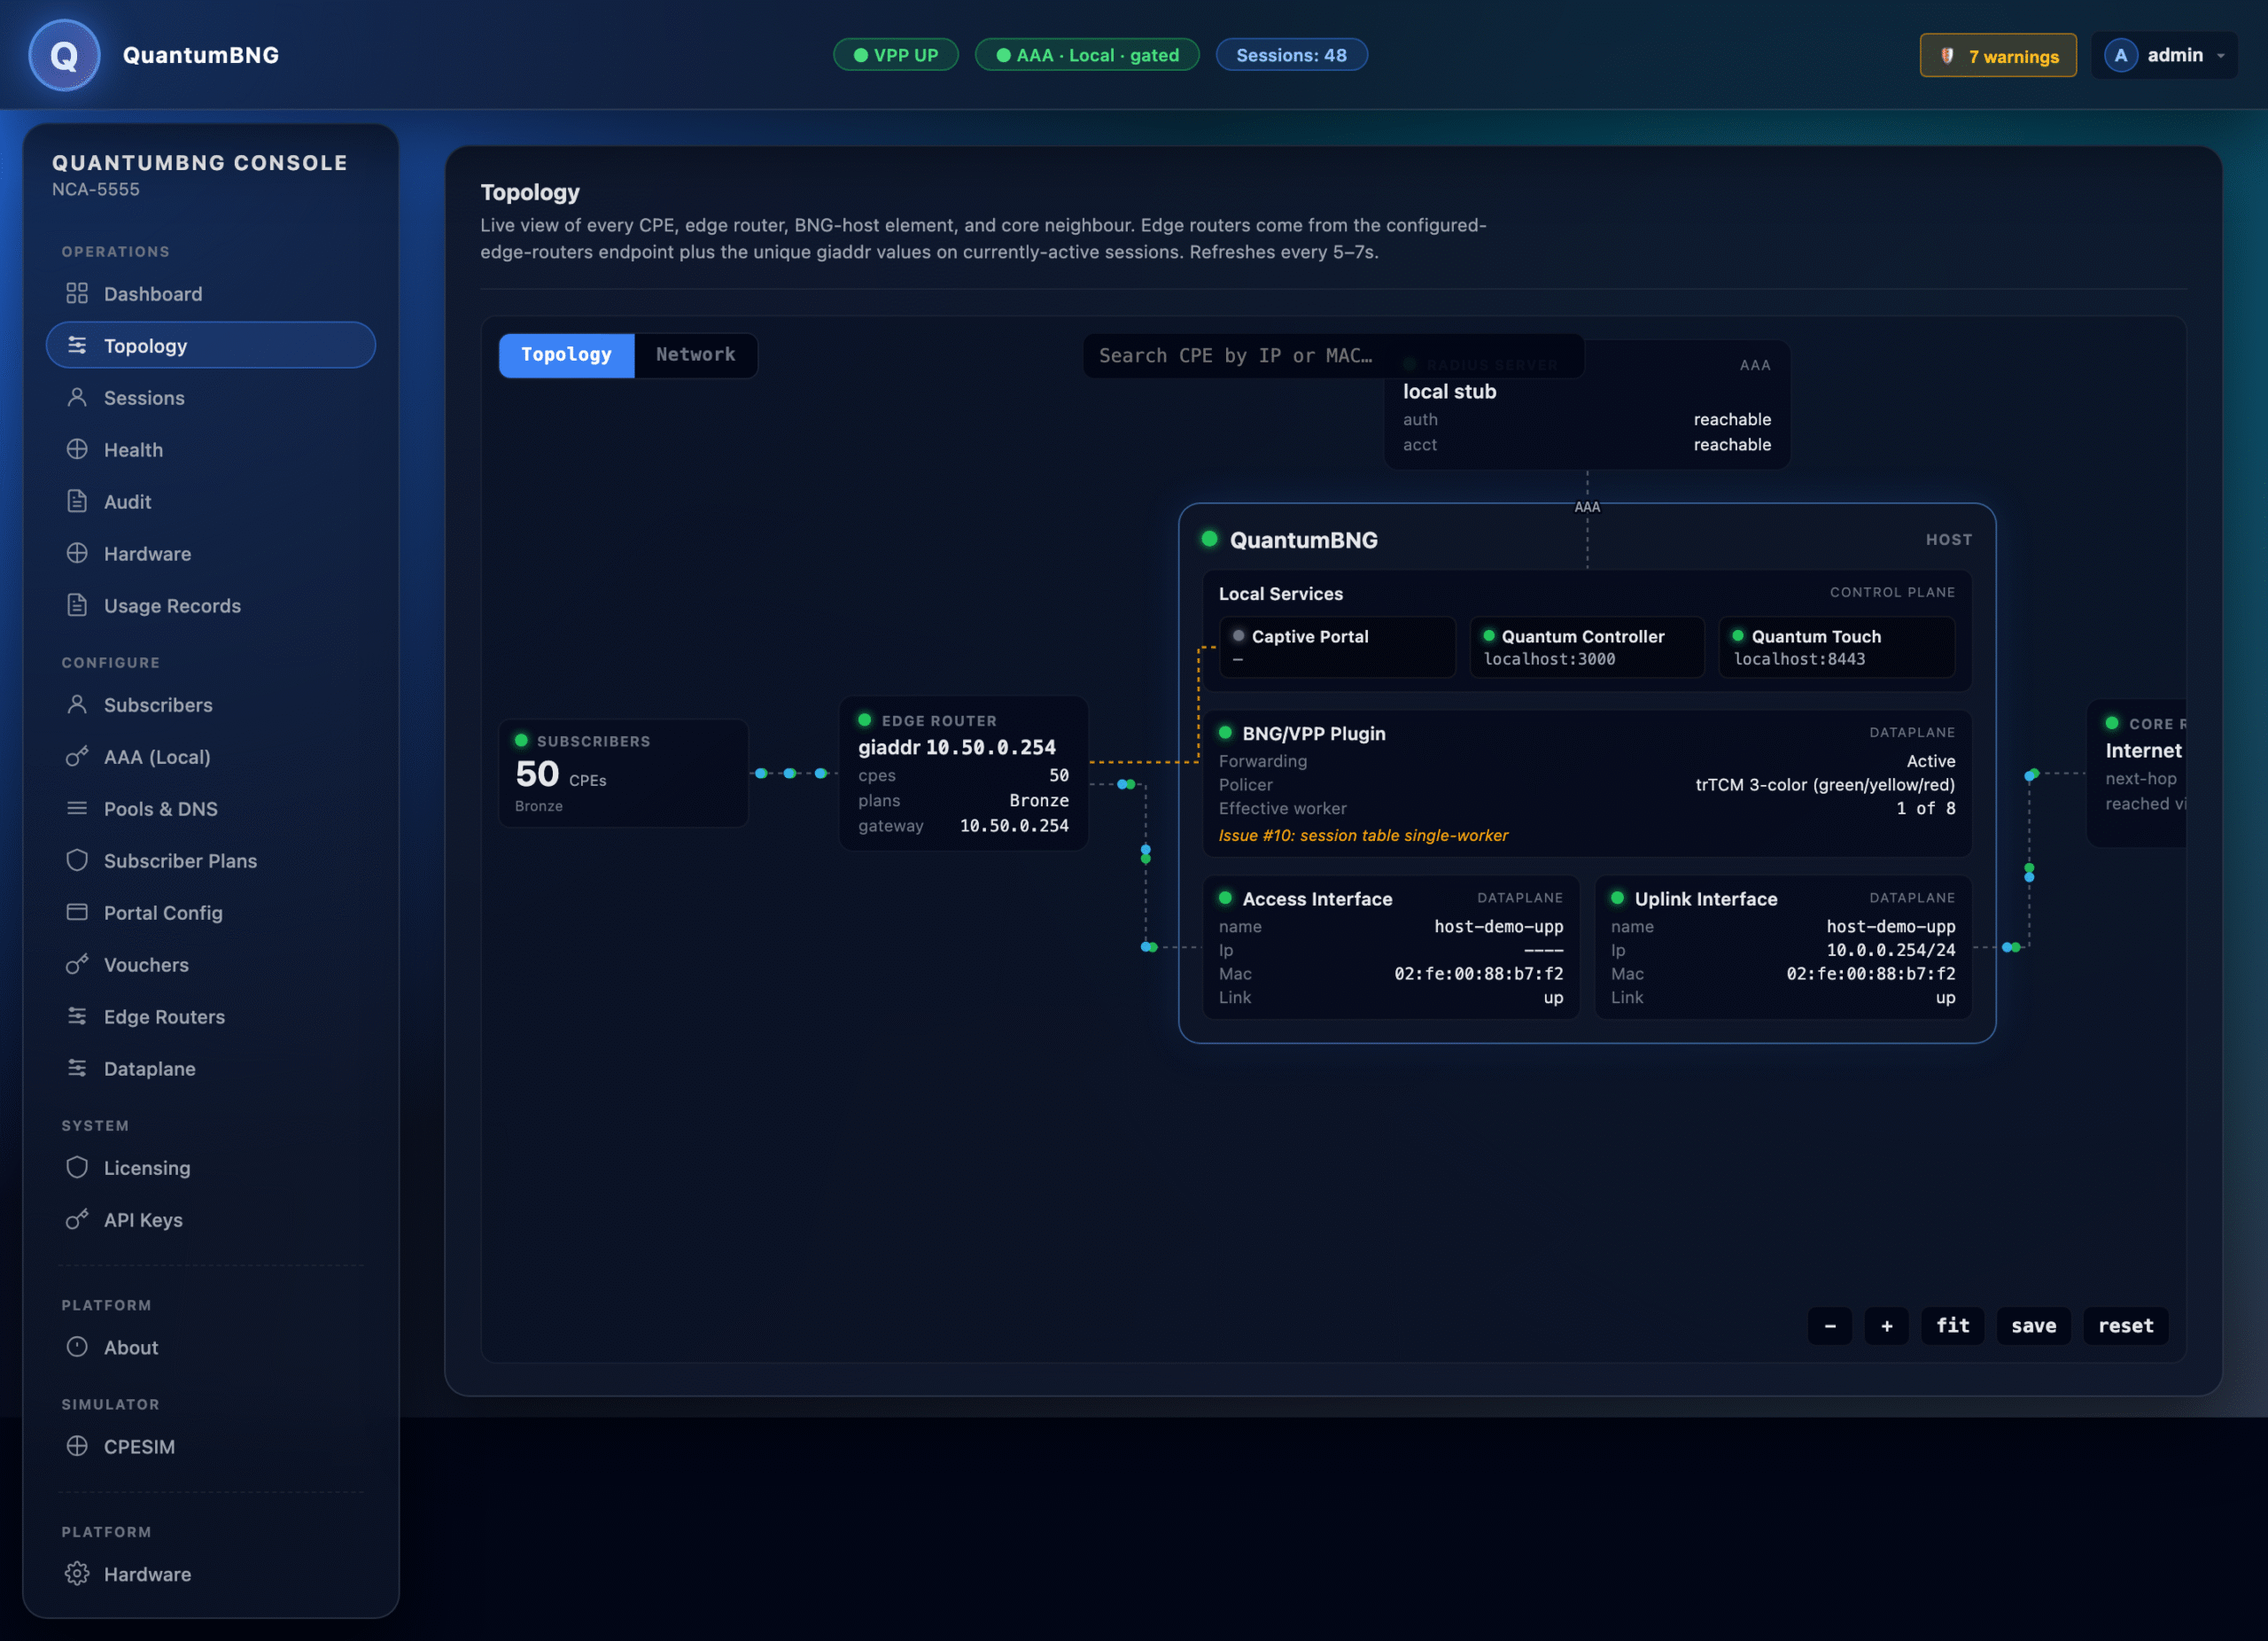
Green dots = healthy. Amber = warning (e.g., access interface down because no cable). Red = broken. Hovers on each element give you IP, MAC, driver, throughput.
Two tabs: Topology — network connectivity + per-element status (the view above) — and Network — bandwidth measurements at key points in the system (edge, uplink, per-interface throughput).
Sessions
Every current subscriber session. Filter by state (Connected / Captive / Offering / All), search by IP / MAC / plan / giaddr.
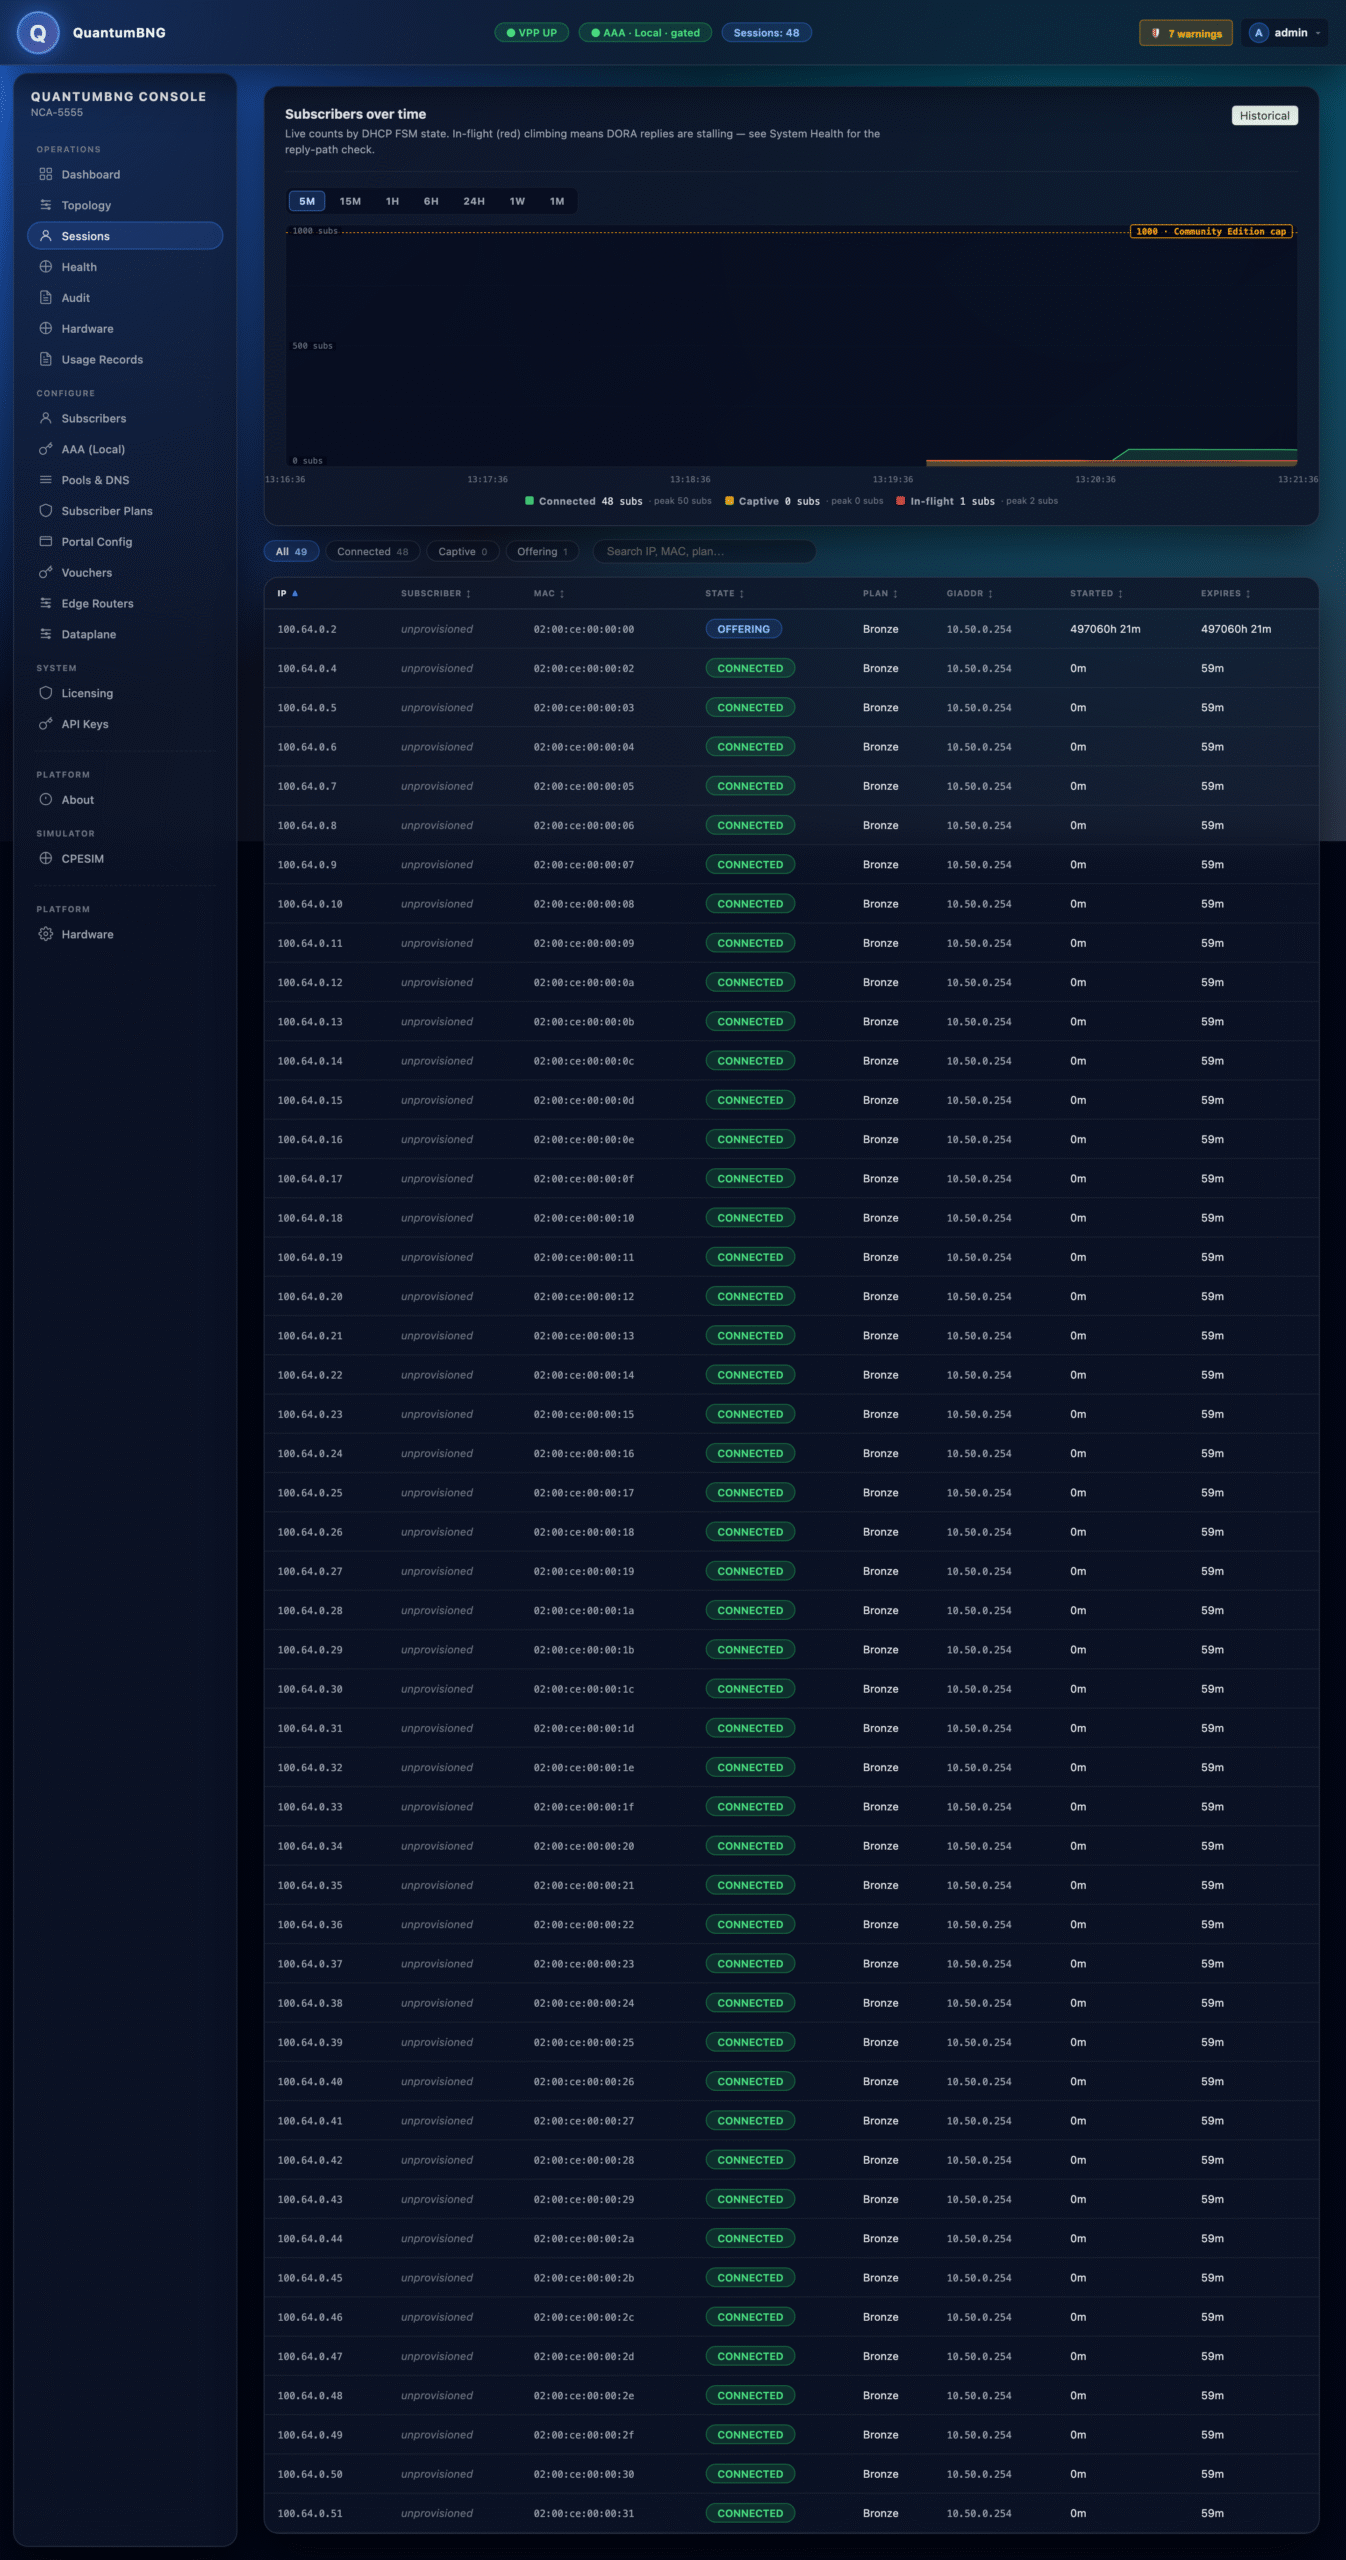
The "Subscribers over time" chart at the top shows connected + captive + in-flight over your chosen range. Persistent in-flight (red) with low connected typically means the DHCP reply path is stalled — see the Health page's reply-path check.
Click any session row to open the Session Drawer (right-side panel): live per-session traffic sparkline, session events (DORA, plan changes, disconnects), operator actions (disconnect, re-rate, move to captive).
Health
Subsystem-by-subsystem diagnostic page. Every check has a green/amber/red pill, a description of what the check verifies, and a "why this matters" note.
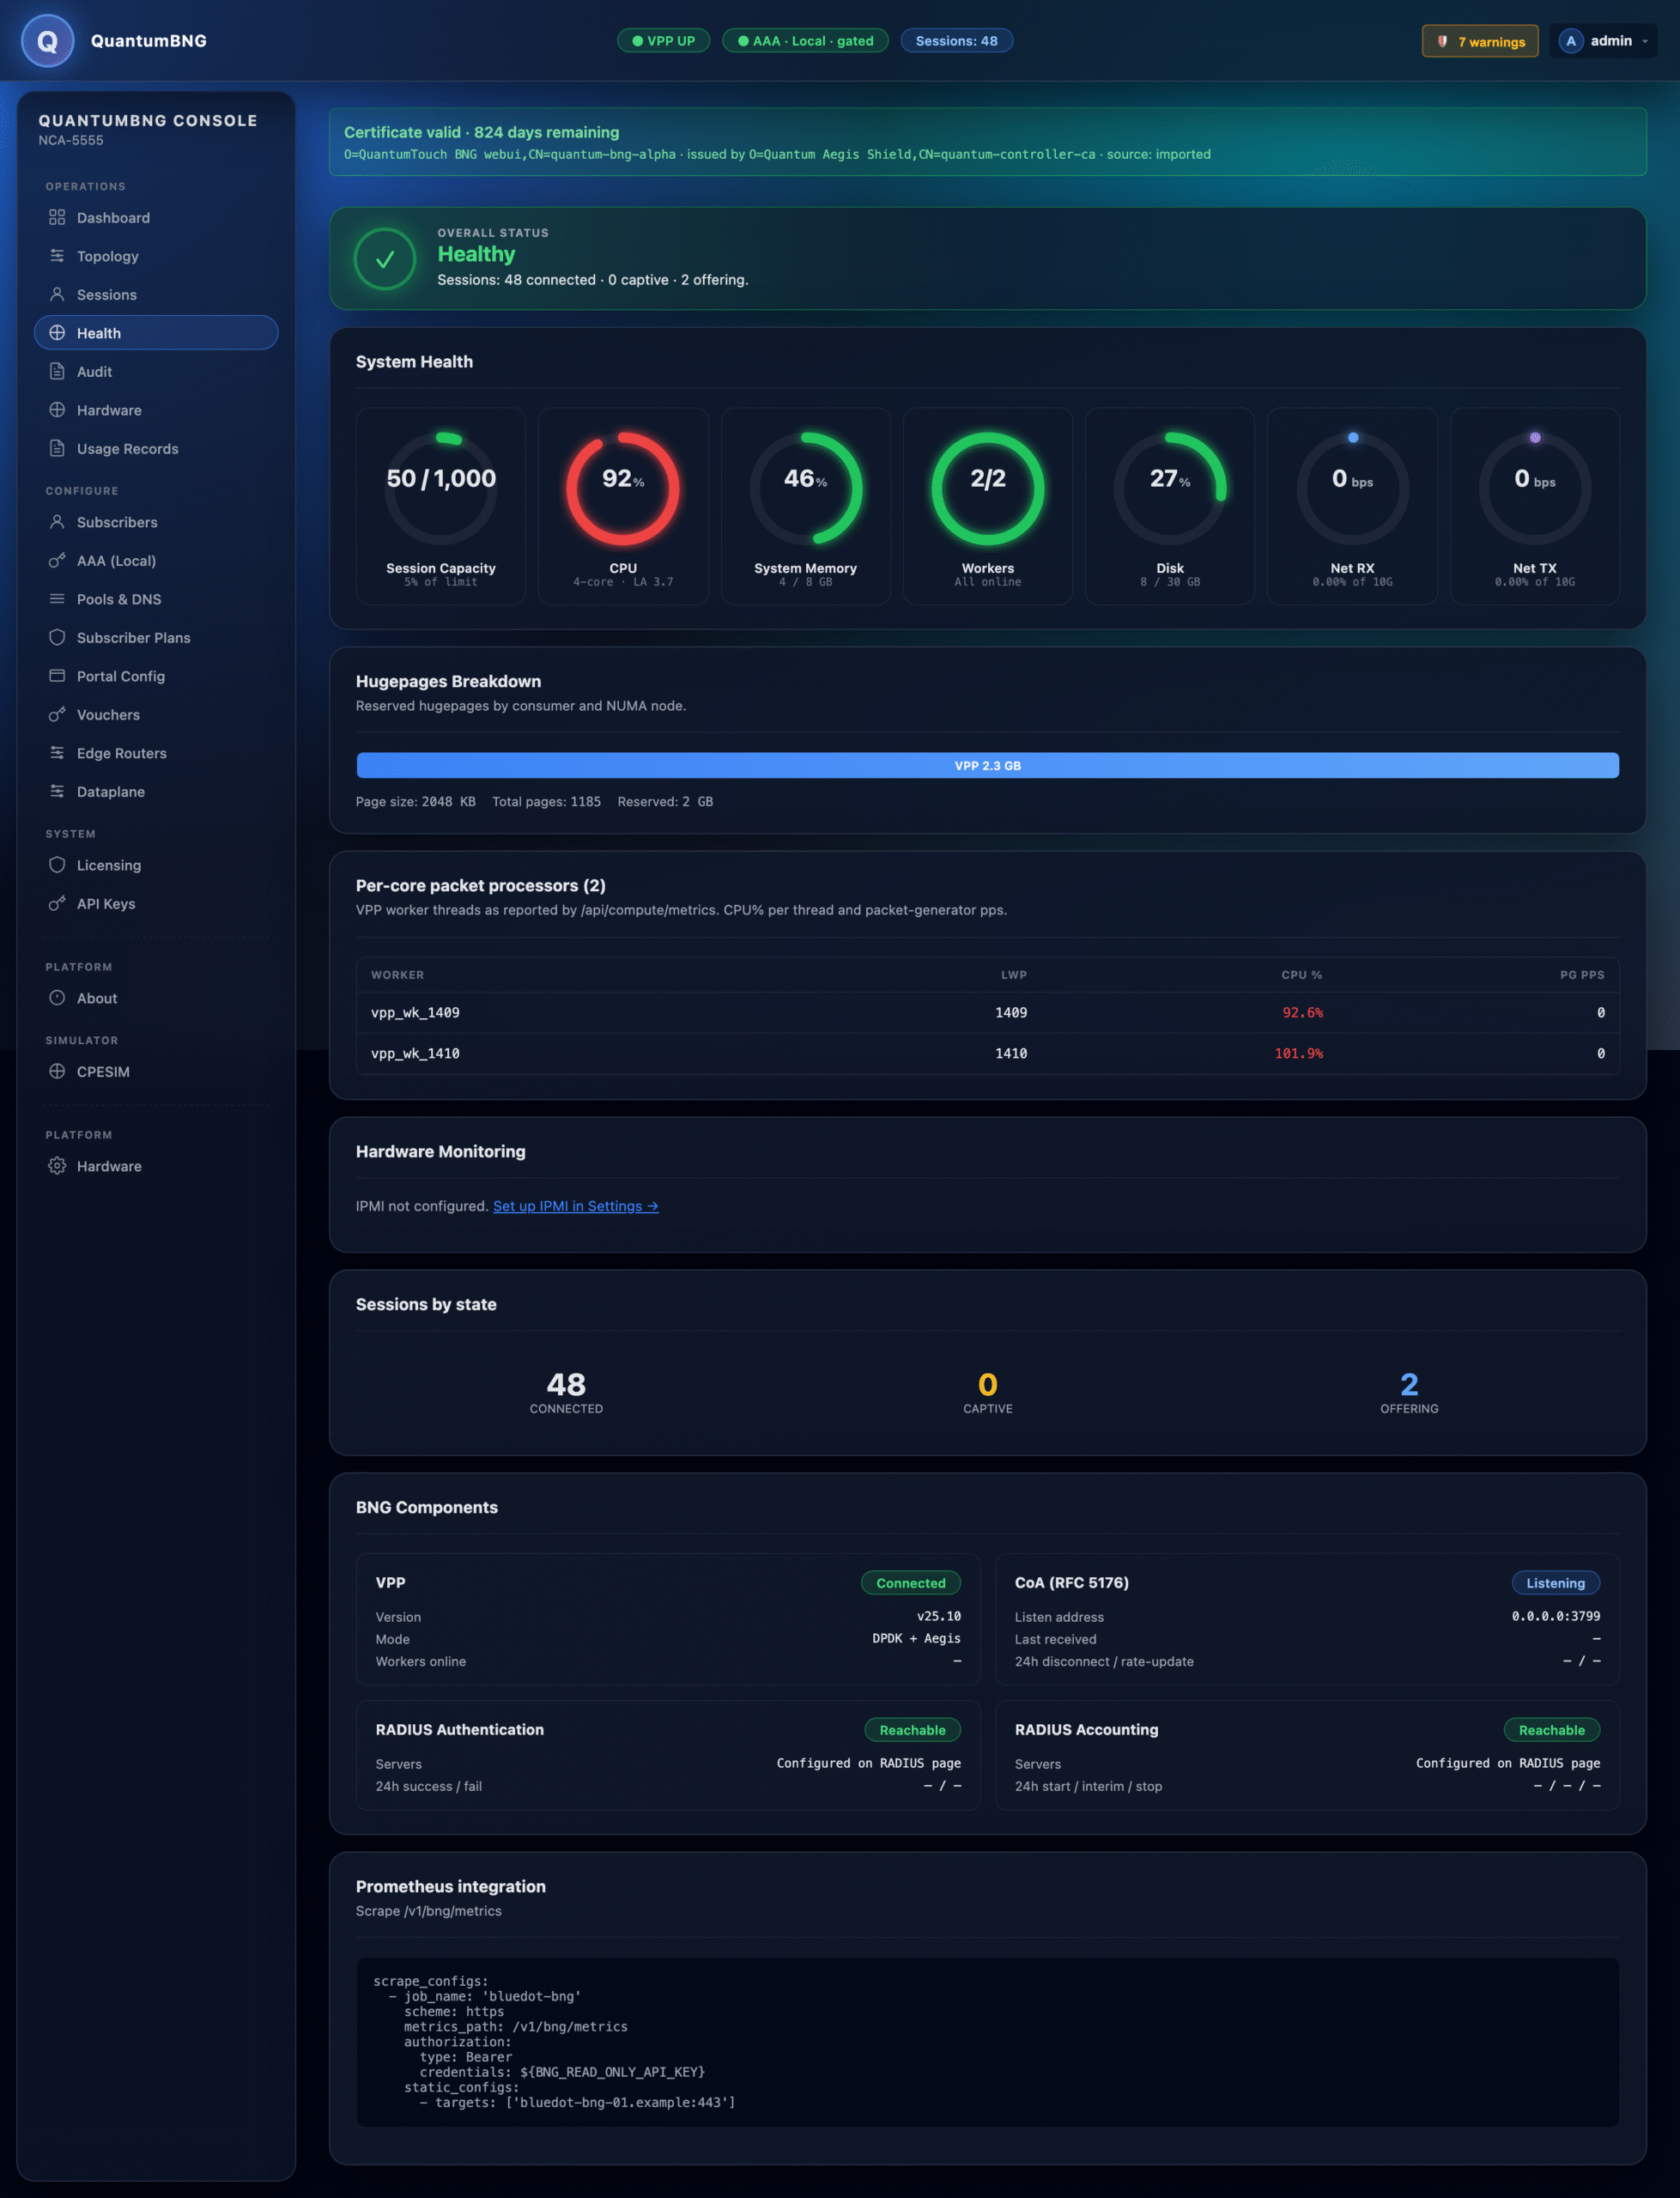
Checks include: TLS cert expiry, controller ↔ vpp-bridge connection, punt socket health, reply-path stall detector (see the memory note about tx_pps < rx_pps × 0.5 under load), snapshot store size, audit shipper backlog, AAA provider reachability.
Two sub-tabs: Health (checks) and Workers (VPP worker CPU utilization + per-worker packet counts — helpful to see if your corelist-workers sizing matches your traffic load).
Audit
Every operator action and every controller-observed event, correlated across QT audit
log, controller API log and systemd journal — plus, optionally, decoded RADIUS
exchanges.
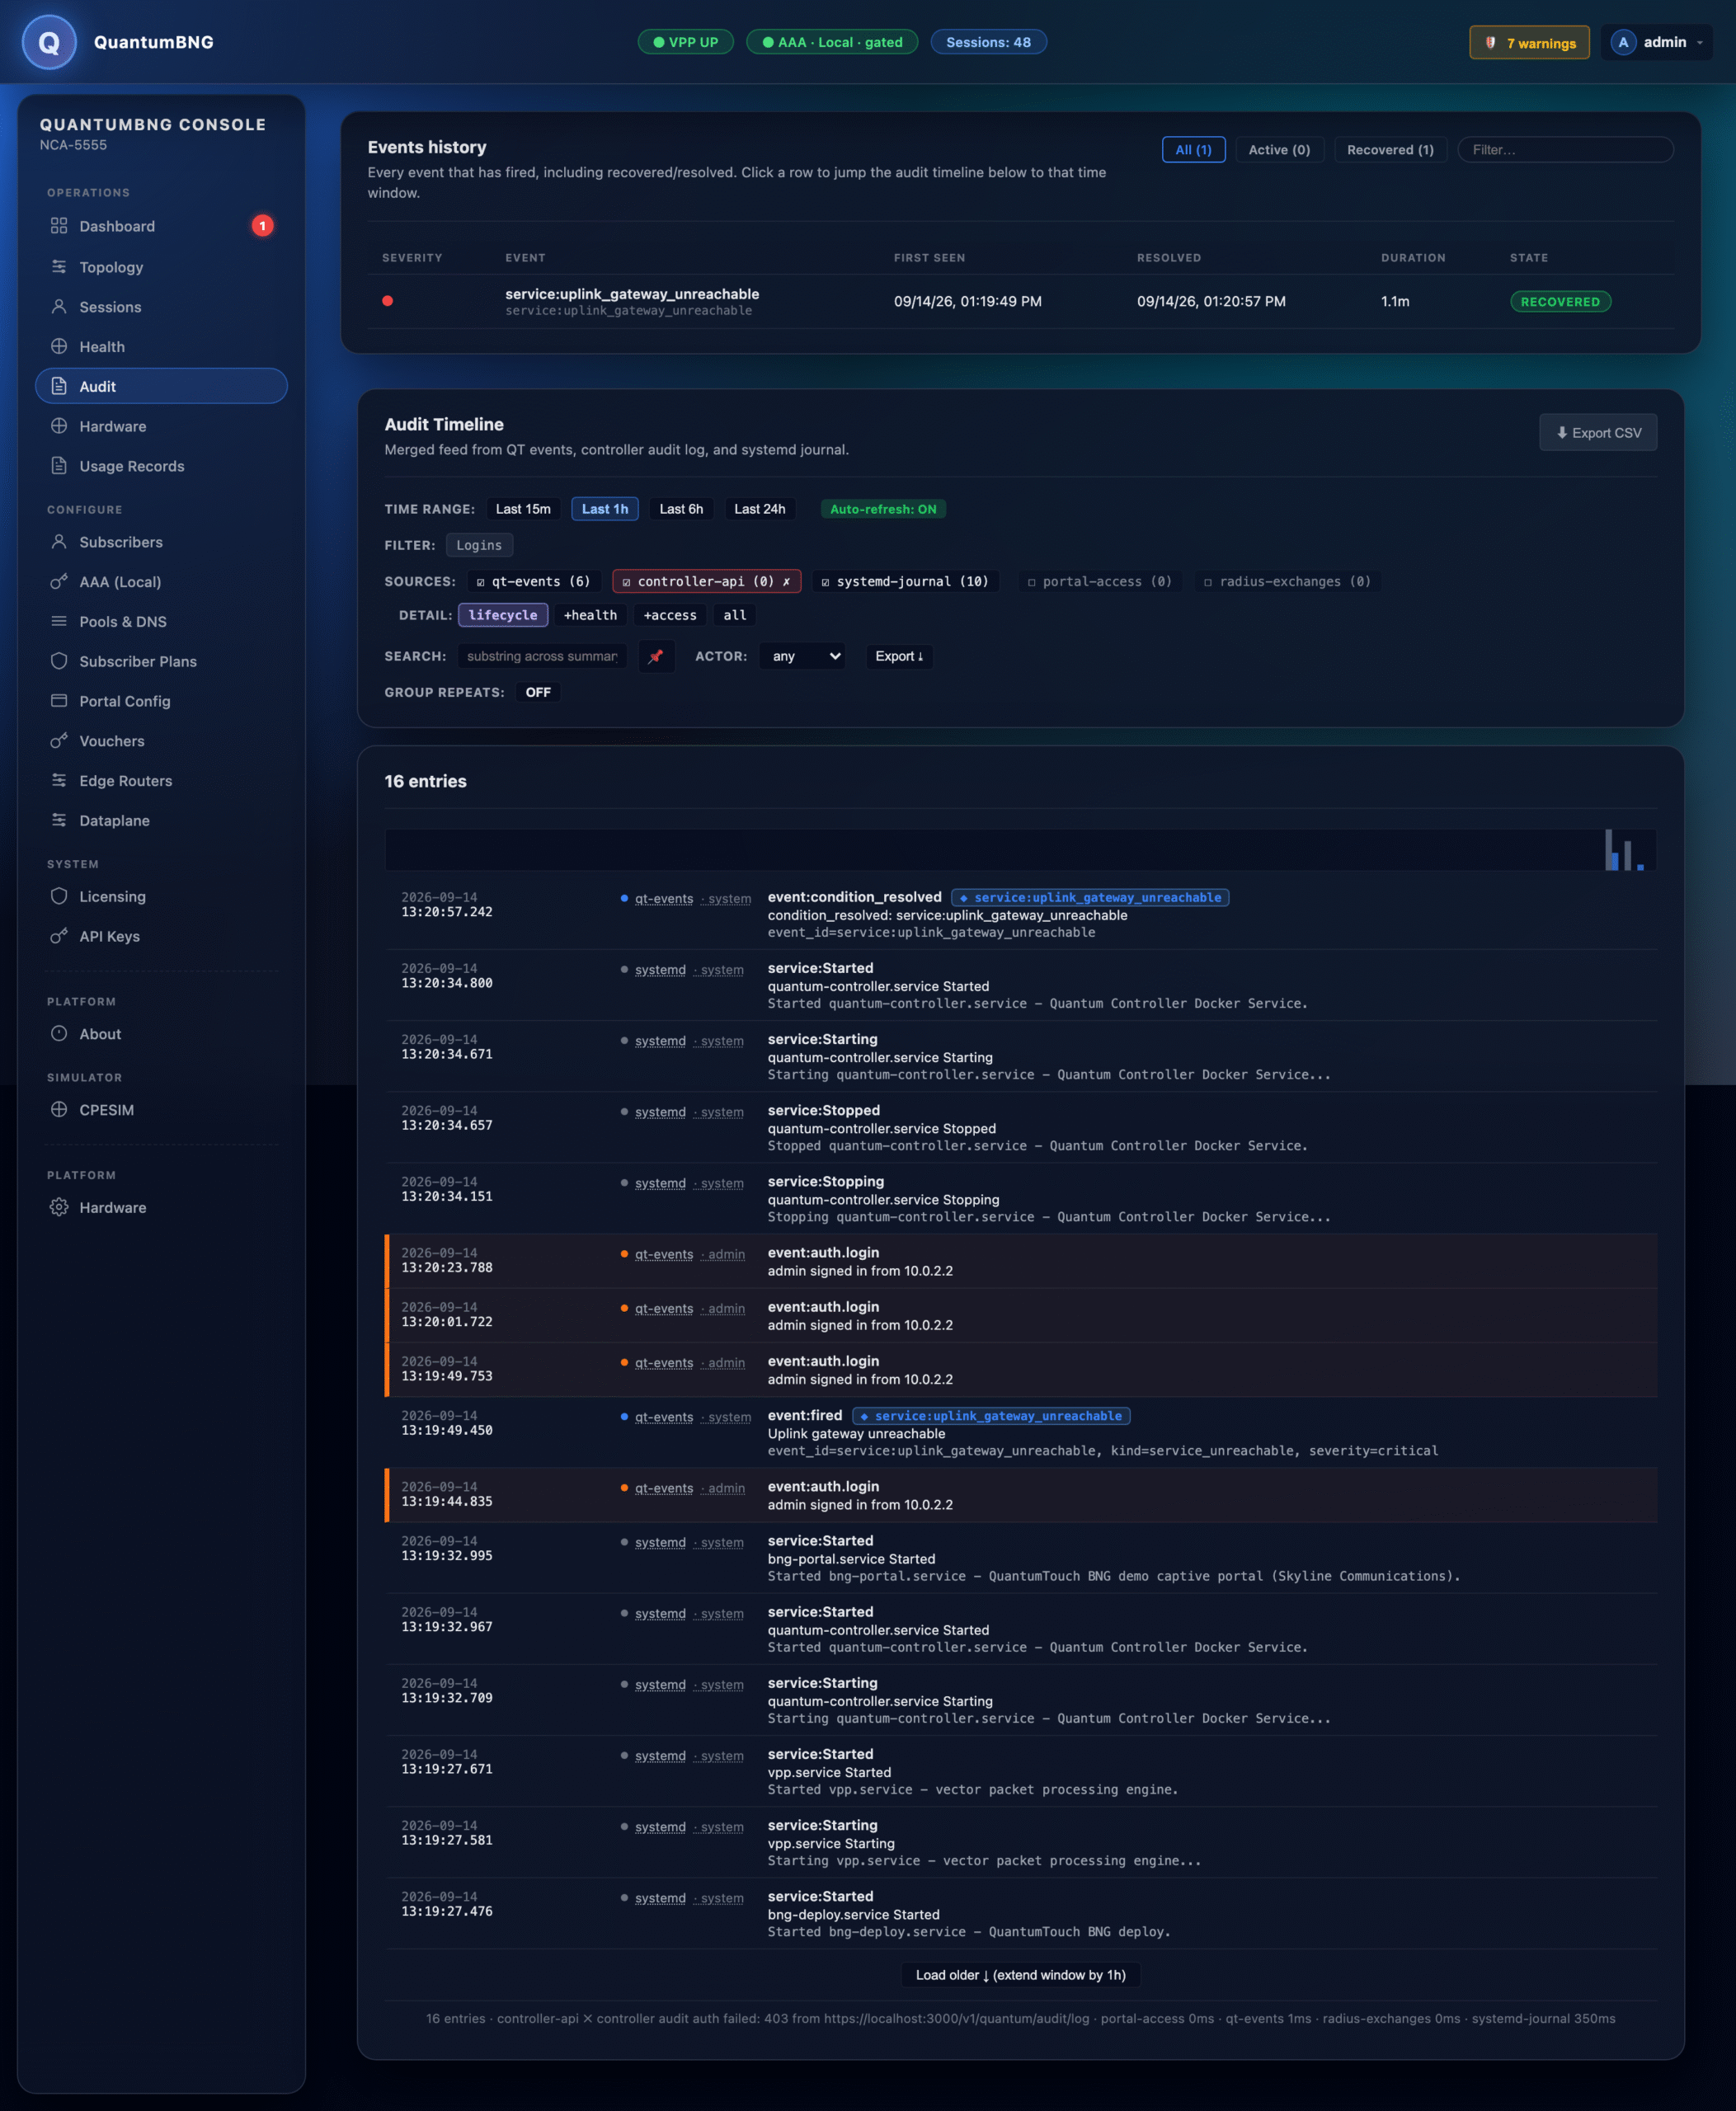
The timeline defaults to "live tail" — click Return to live if you scroll back. Each row includes:
- Timestamp + source (QT / Controller / Journal)
- Actor (username, API key ID, or
system) - Event kind + one-line description
- Rev-ID chip (linkable back to the source log line)
Use the date+time filters top-right to scope. Click Verbose journal to include noisy
systemd events (default off).
RADIUS exchanges (optional, off by default). Enabling the radius-exchanges source
captures RADIUS traffic the box sees, decodes and lints it, and shows the exchanges on
this timeline beside everything else — so a failing subscriber authentication can be read
here instead of with tcpdump. Shared secrets are read for verification and never
written to the log.
Two things worth knowing before you turn it on. It is off by default and publishes
nothing when off, so an empty RADIUS lane means "not capturing", not "nothing happened".
And because it records subscriber identifiers, read
"What the RADIUS exchange timeline records about your subscribers" first — it sets
out exactly which identifiers are written, where the file goes, and what does and does
not leave the box.
Hardware / Compute
Hardware inventory (NICs, CPU, mem, disk) plus VPP CPU/worker mapping.
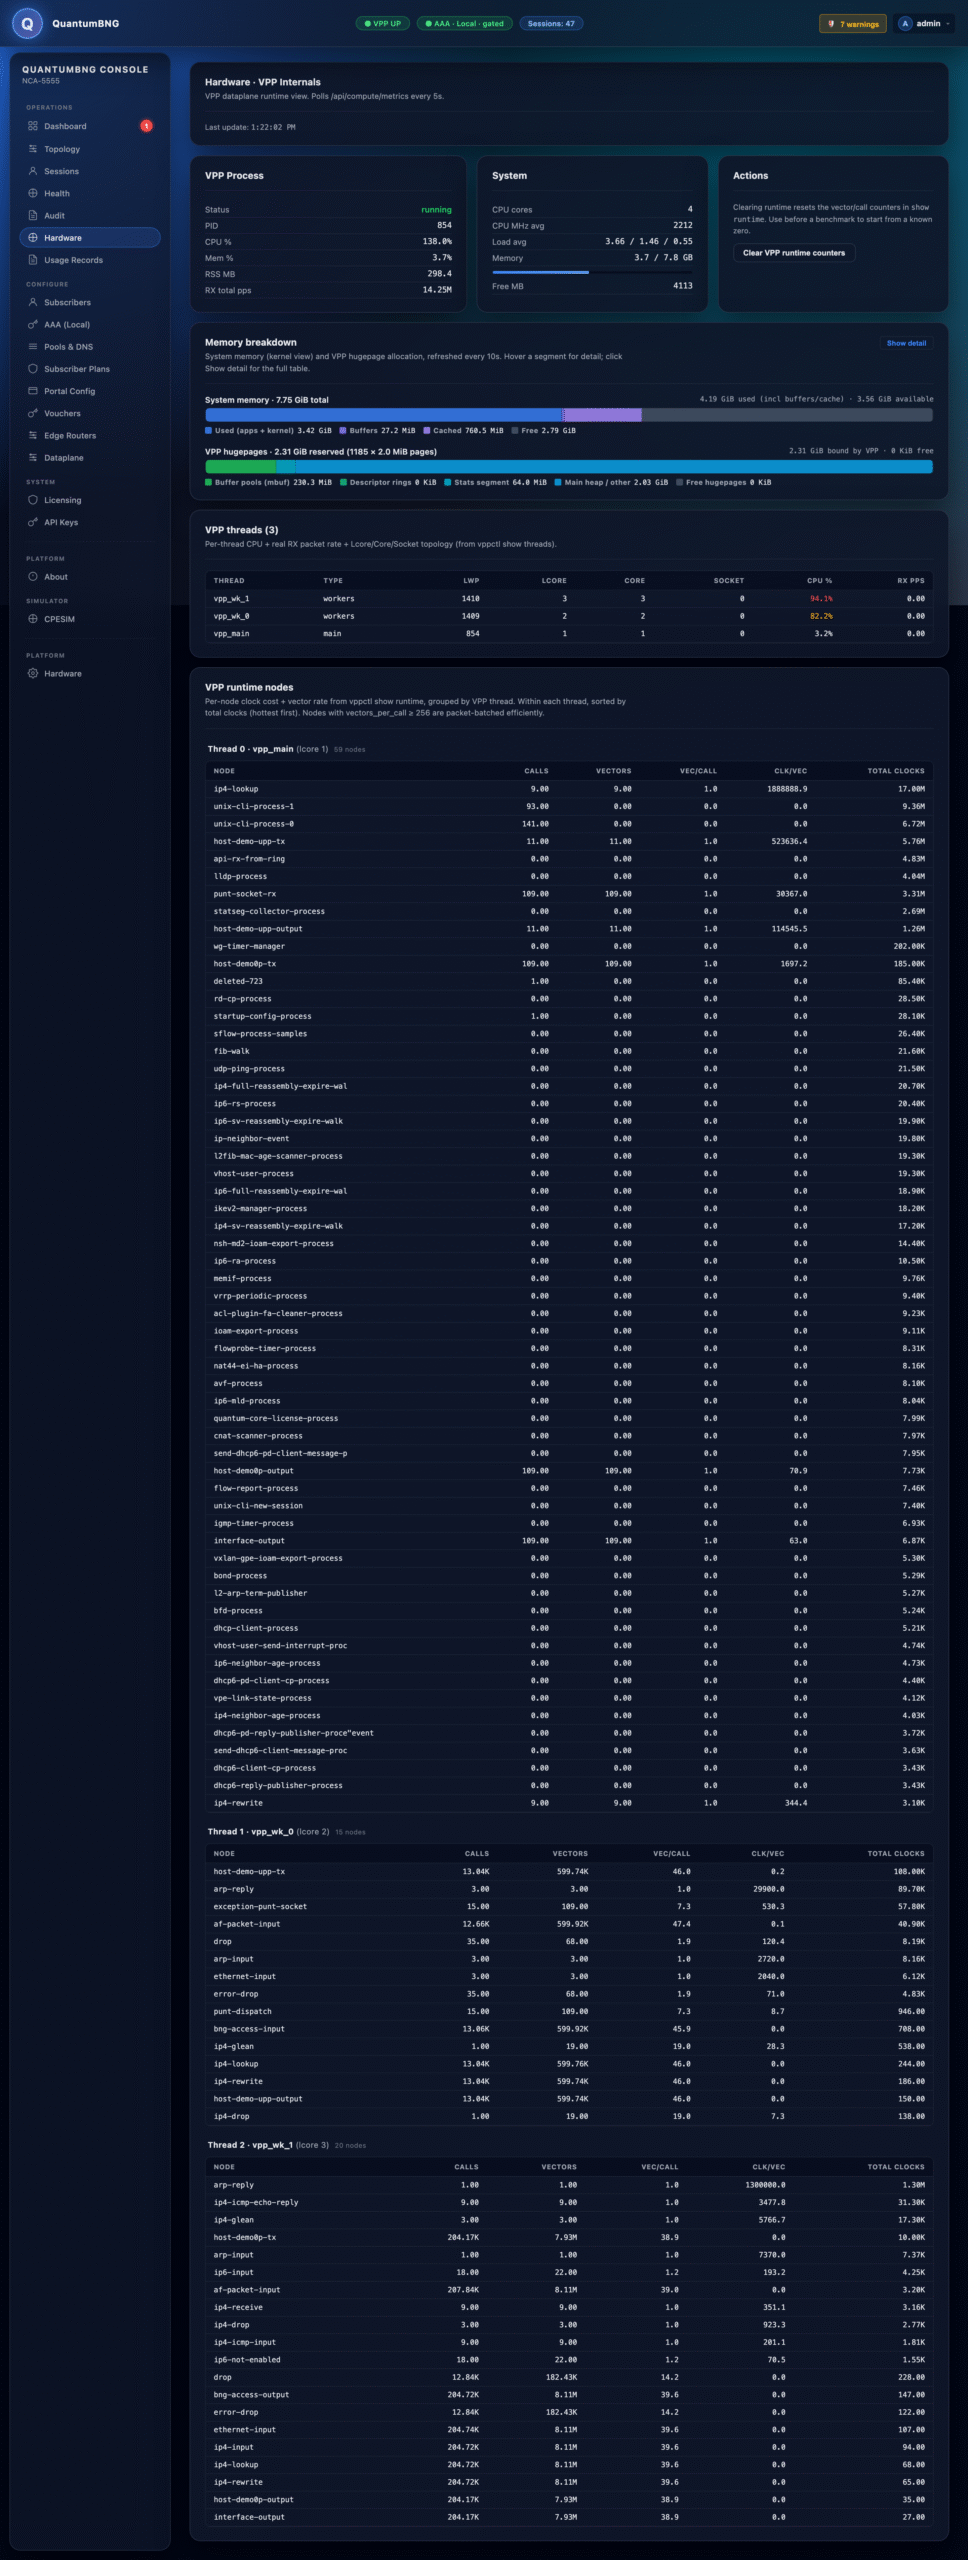
Use this page to sanity-check your box config before opening a support ticket: it shows exactly what VPP thinks it has (corelist-workers, hugepages, buffer allocations, per-worker queue placements) alongside what the kernel thinks it has (isolcpus, NUMA topology, IOMMU groups).
Subscribers
The provisioned-subscriber list (AAA source of truth). This is the roster of who's allowed to onboard; it's not the same as the Sessions list (which is who's currently online).
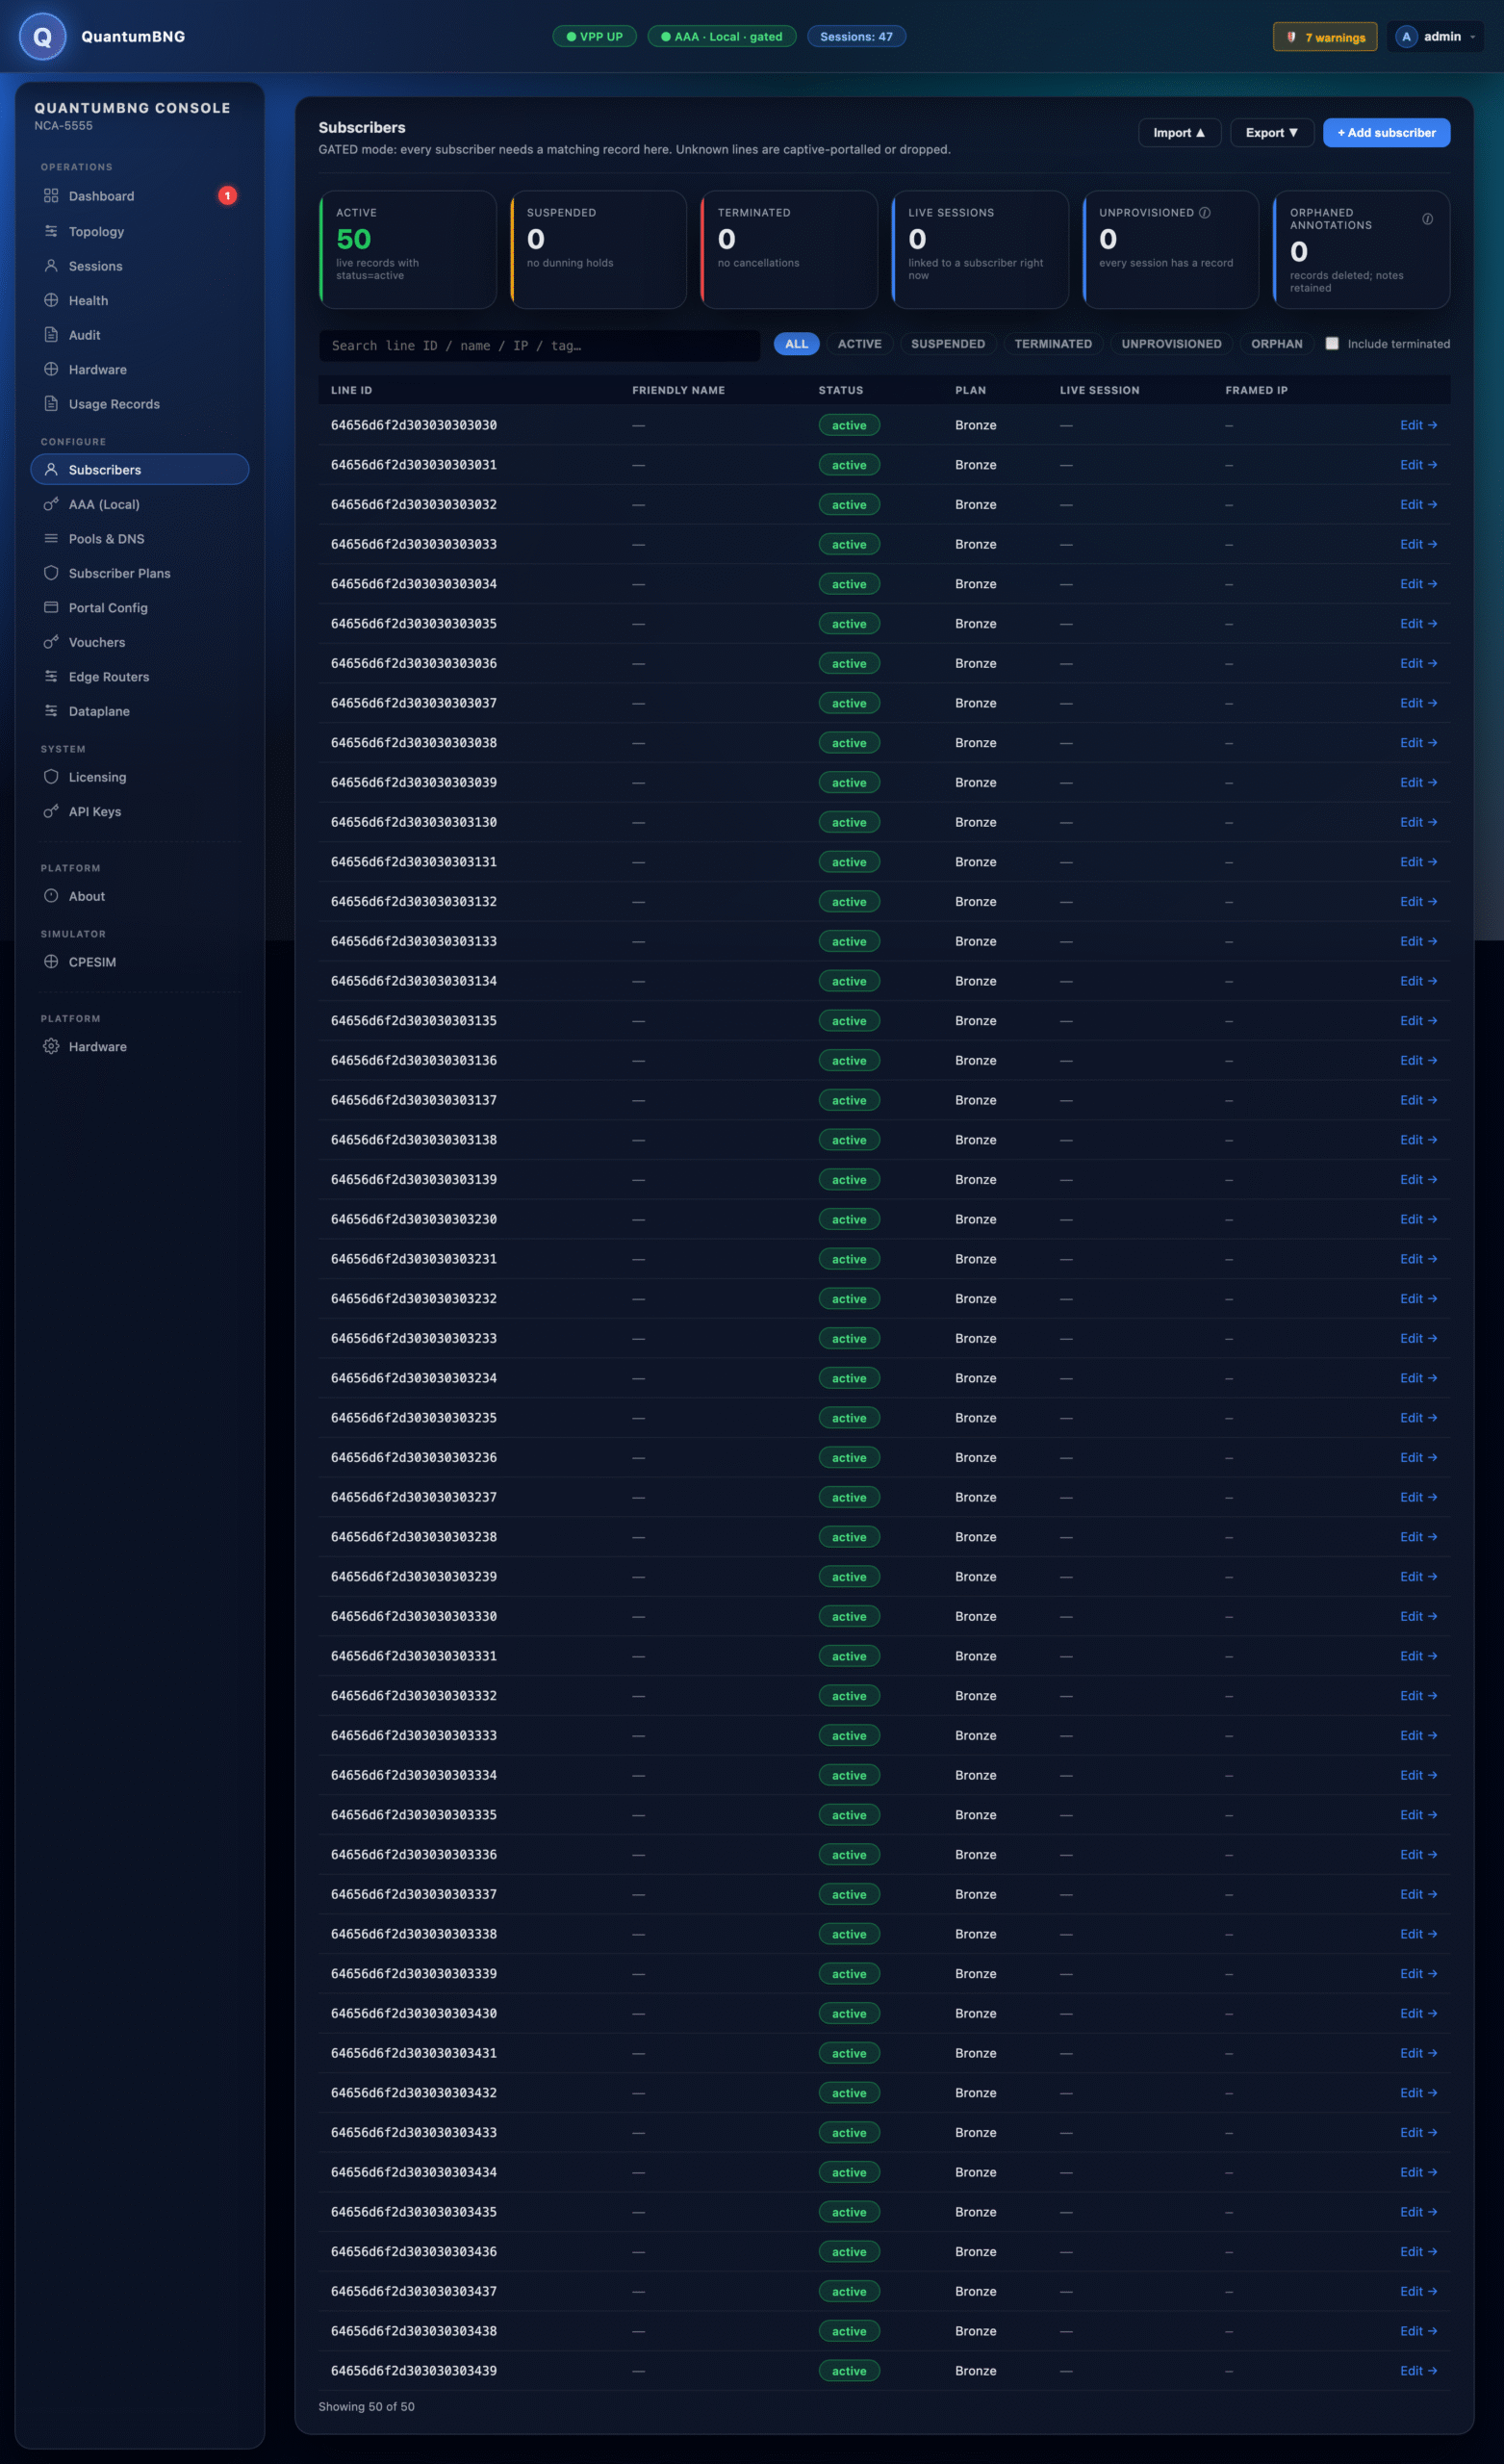
Columns: line identity (DHCP Option 82 circuit-id in hex), plan, status (active / suspended / terminated), lease-time overrides.
Add subscriber button top-right → single-form editor. For bulk import, use the Upload button and a CSV.
AAA (Local)
The local-AAA provider config. Two modes:
- Open — every DHCP DISCOVER is accepted, default plan assigned. Fine for lab / demo / small deployments where every connected device is trusted.
- Gated — only provisioned lines (see Subscribers) are accepted at plan. Unlisted lines get the
unknowndisposition (currentlycaptive→ portal, orreject→ NAK).
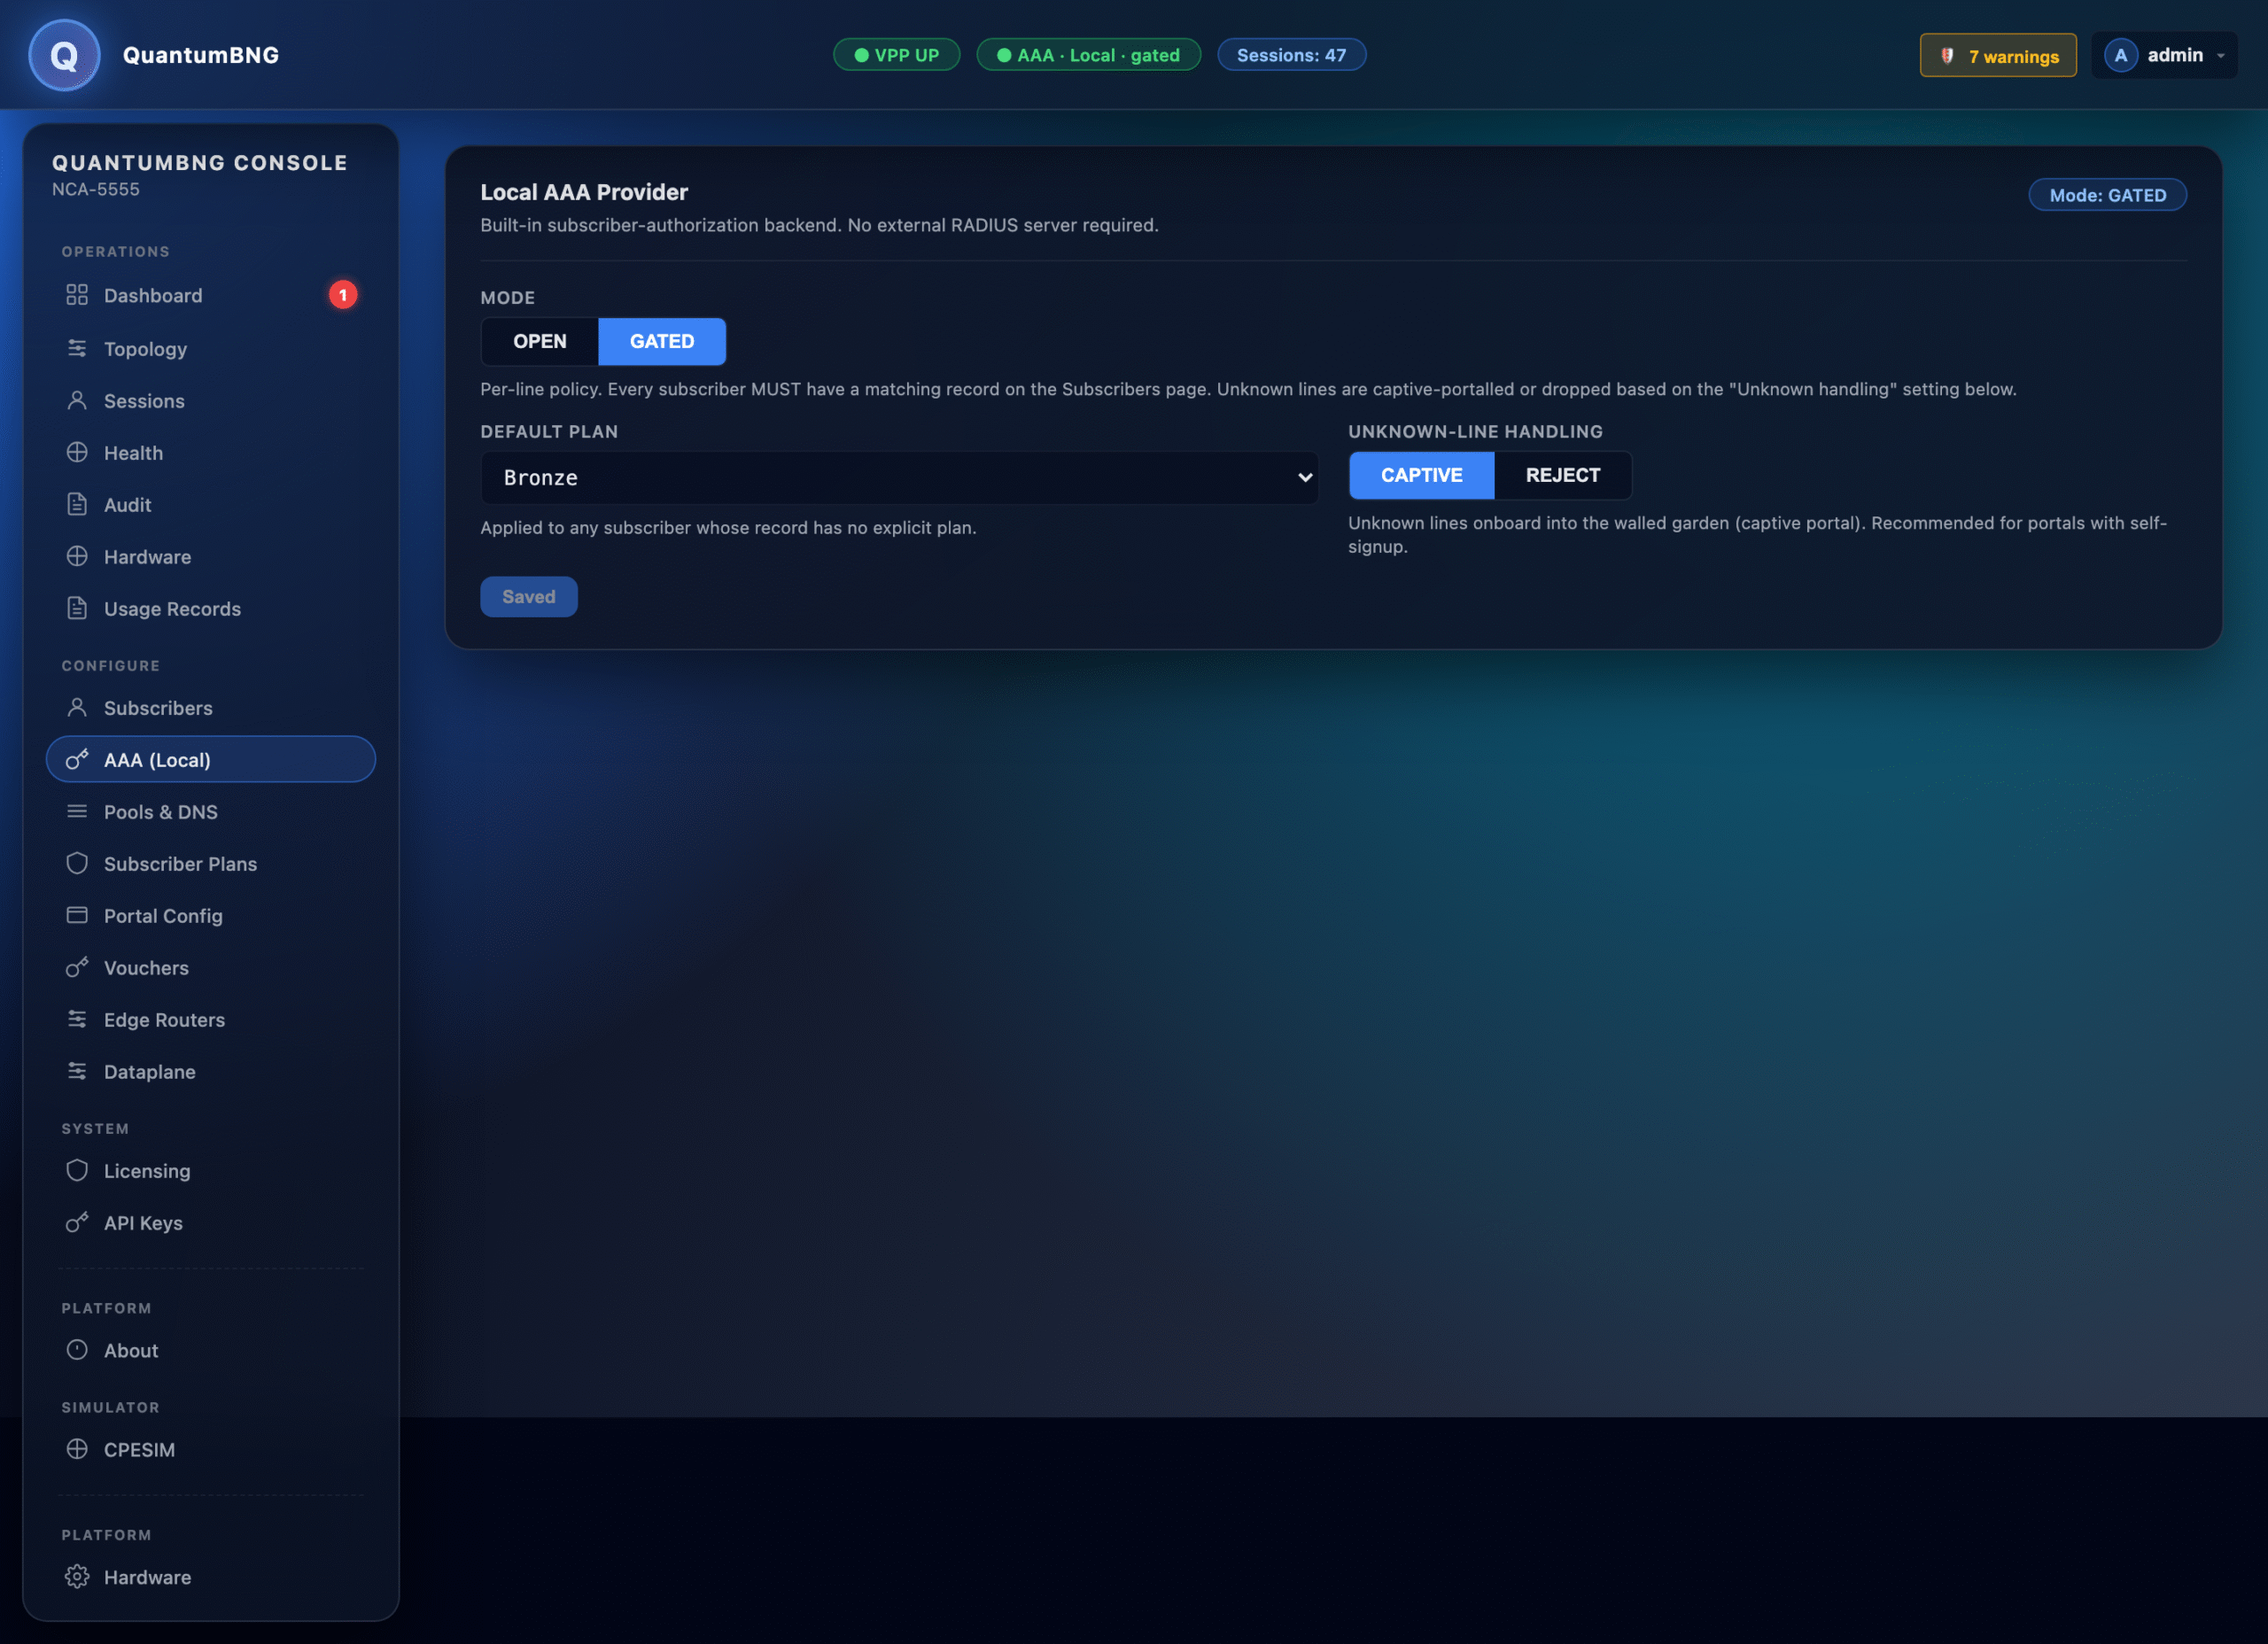
Change with care — flipping from Open to Gated on a running system silently kicks unprovisioned CPEs to captive.
Pools & DNS
The DHCP pools. Each pool has a name, a CIDR range, a lease time, and one or more DNS resolvers.
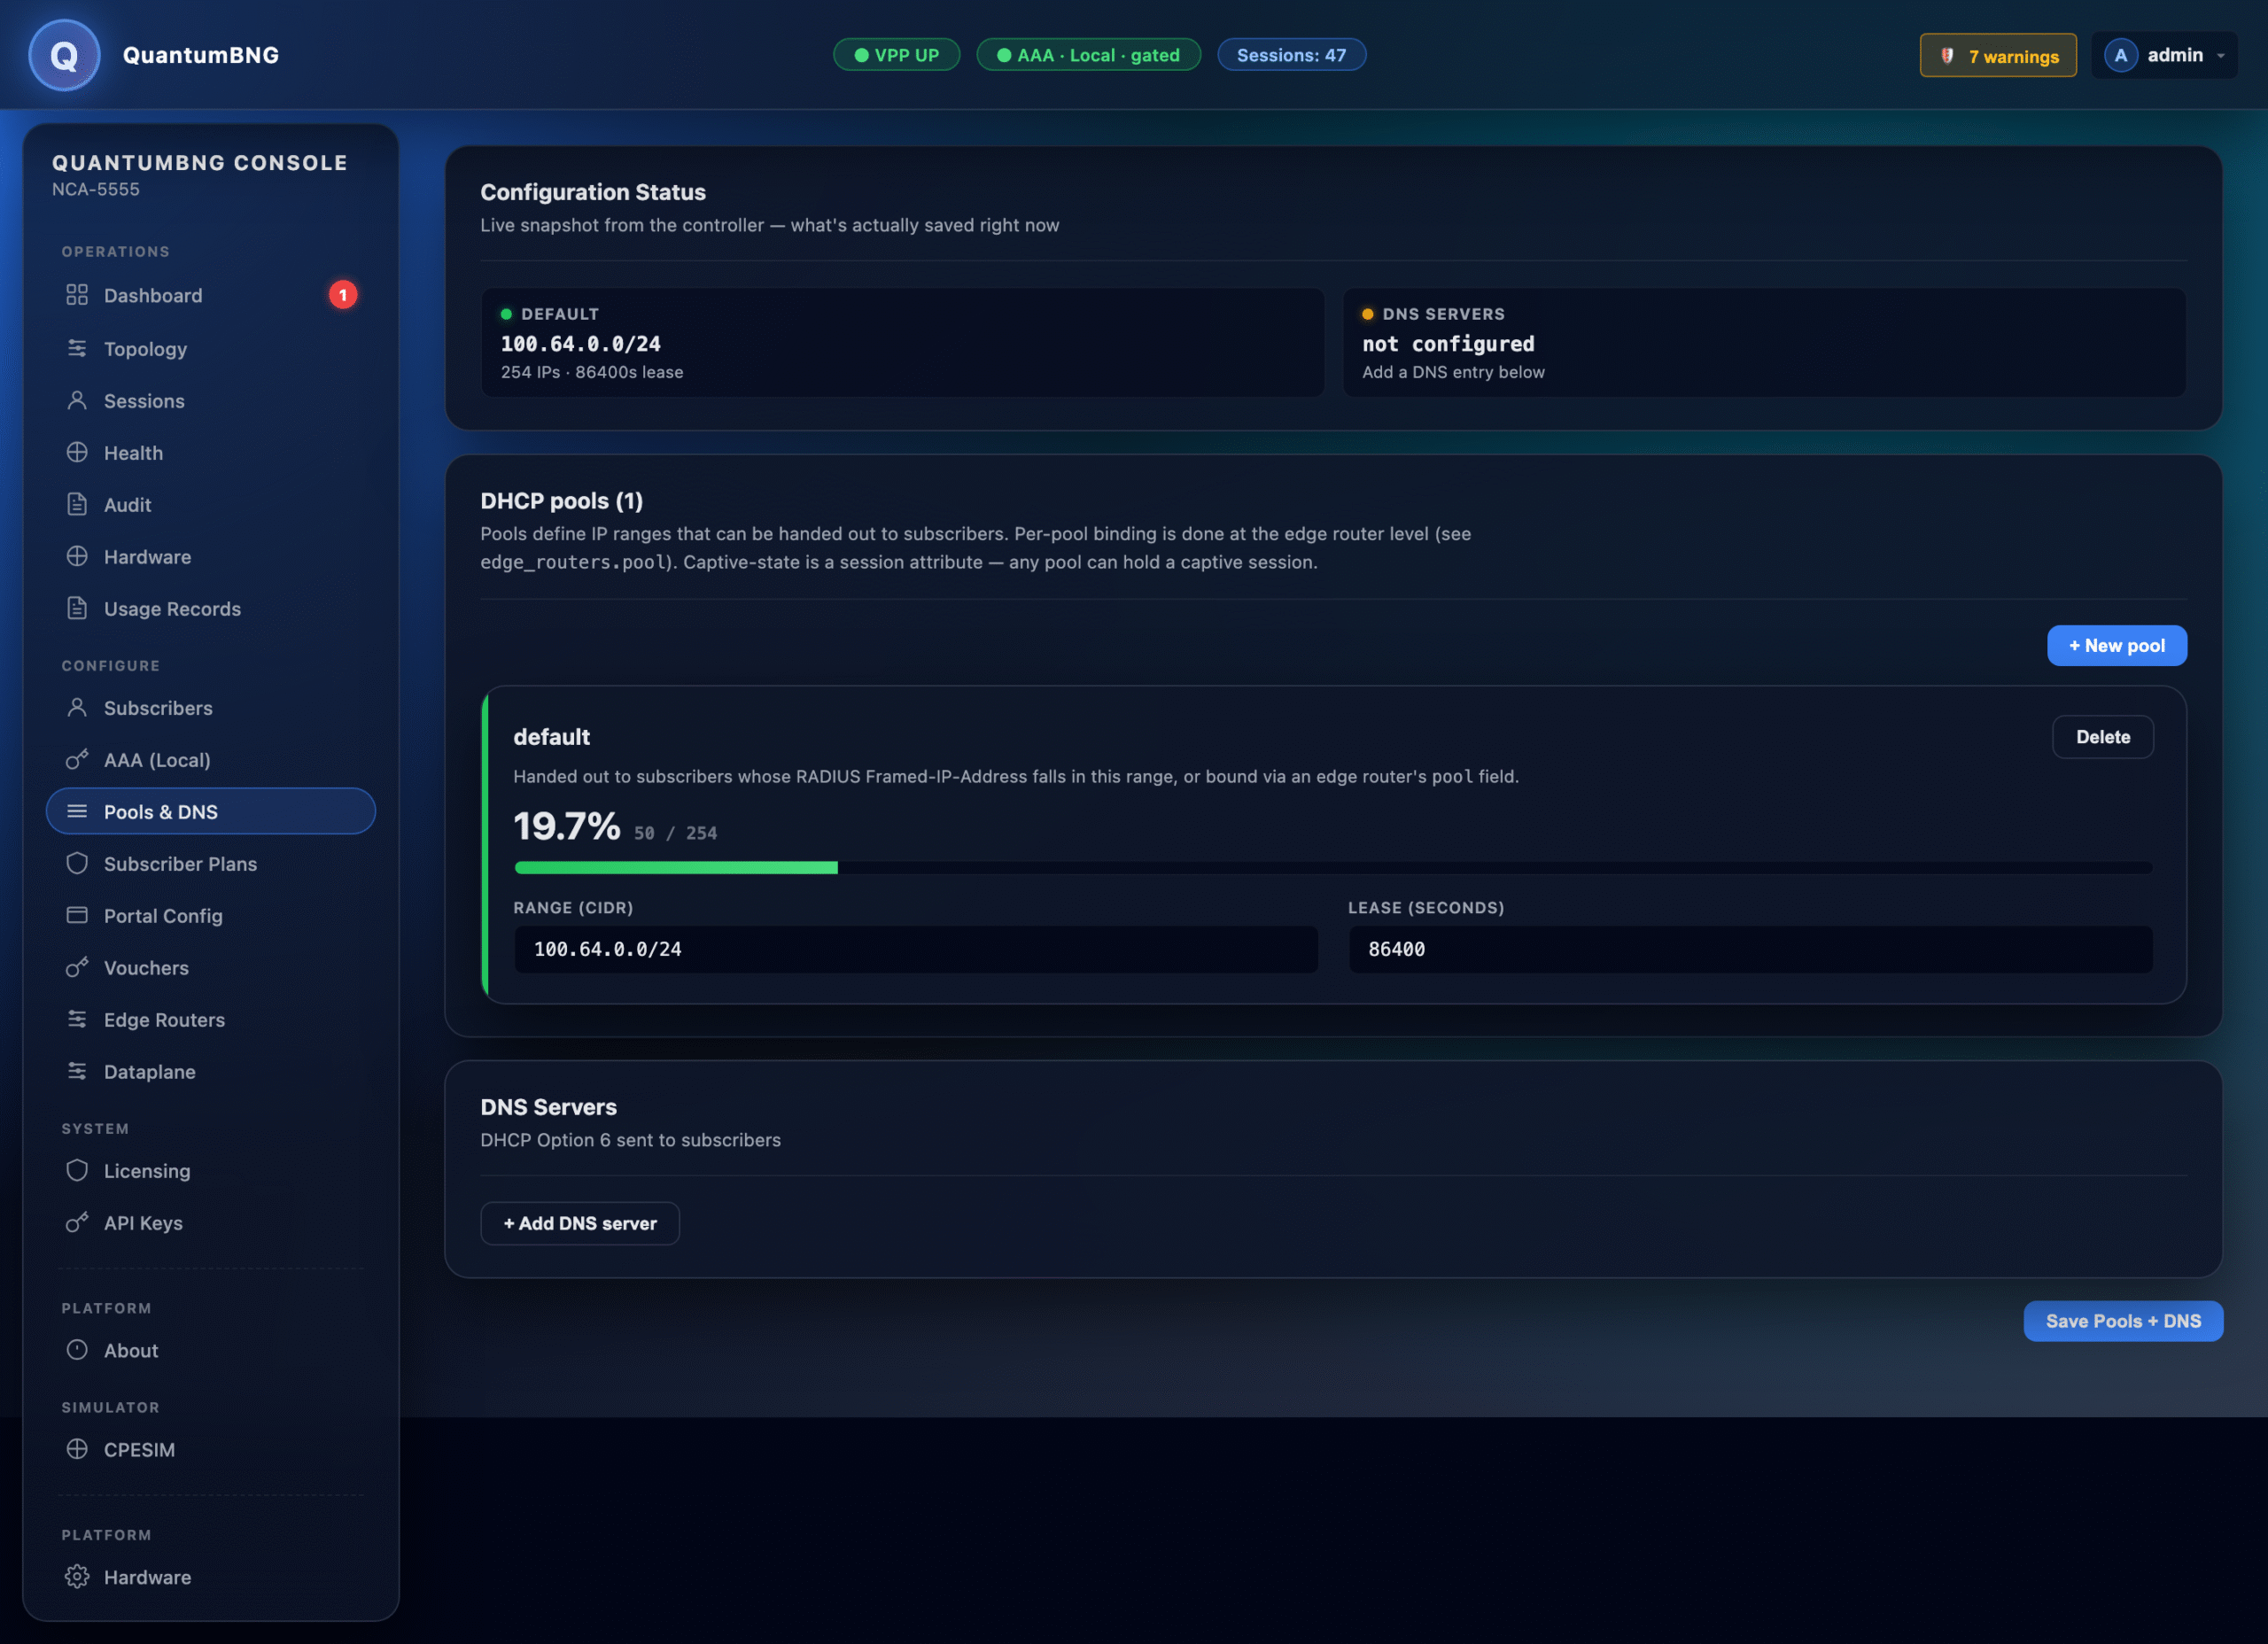
Default pool must exist — the setup wizard creates it. Add more pools if you need per-plan or per-geography allocation.
Pool utilization is shown as a horizontal bar with color-coded thresholds (amber at 80%, red at 95%). Alloc-failure counter shows how many DISCOVERs got NAK'd because the pool was exhausted.
Subscriber Plans
Rate plans — each defines up_cir_kbps, up_pir_kbps, dn_cir_kbps, dn_pir_kbps plus optional session/idle/interim timers.
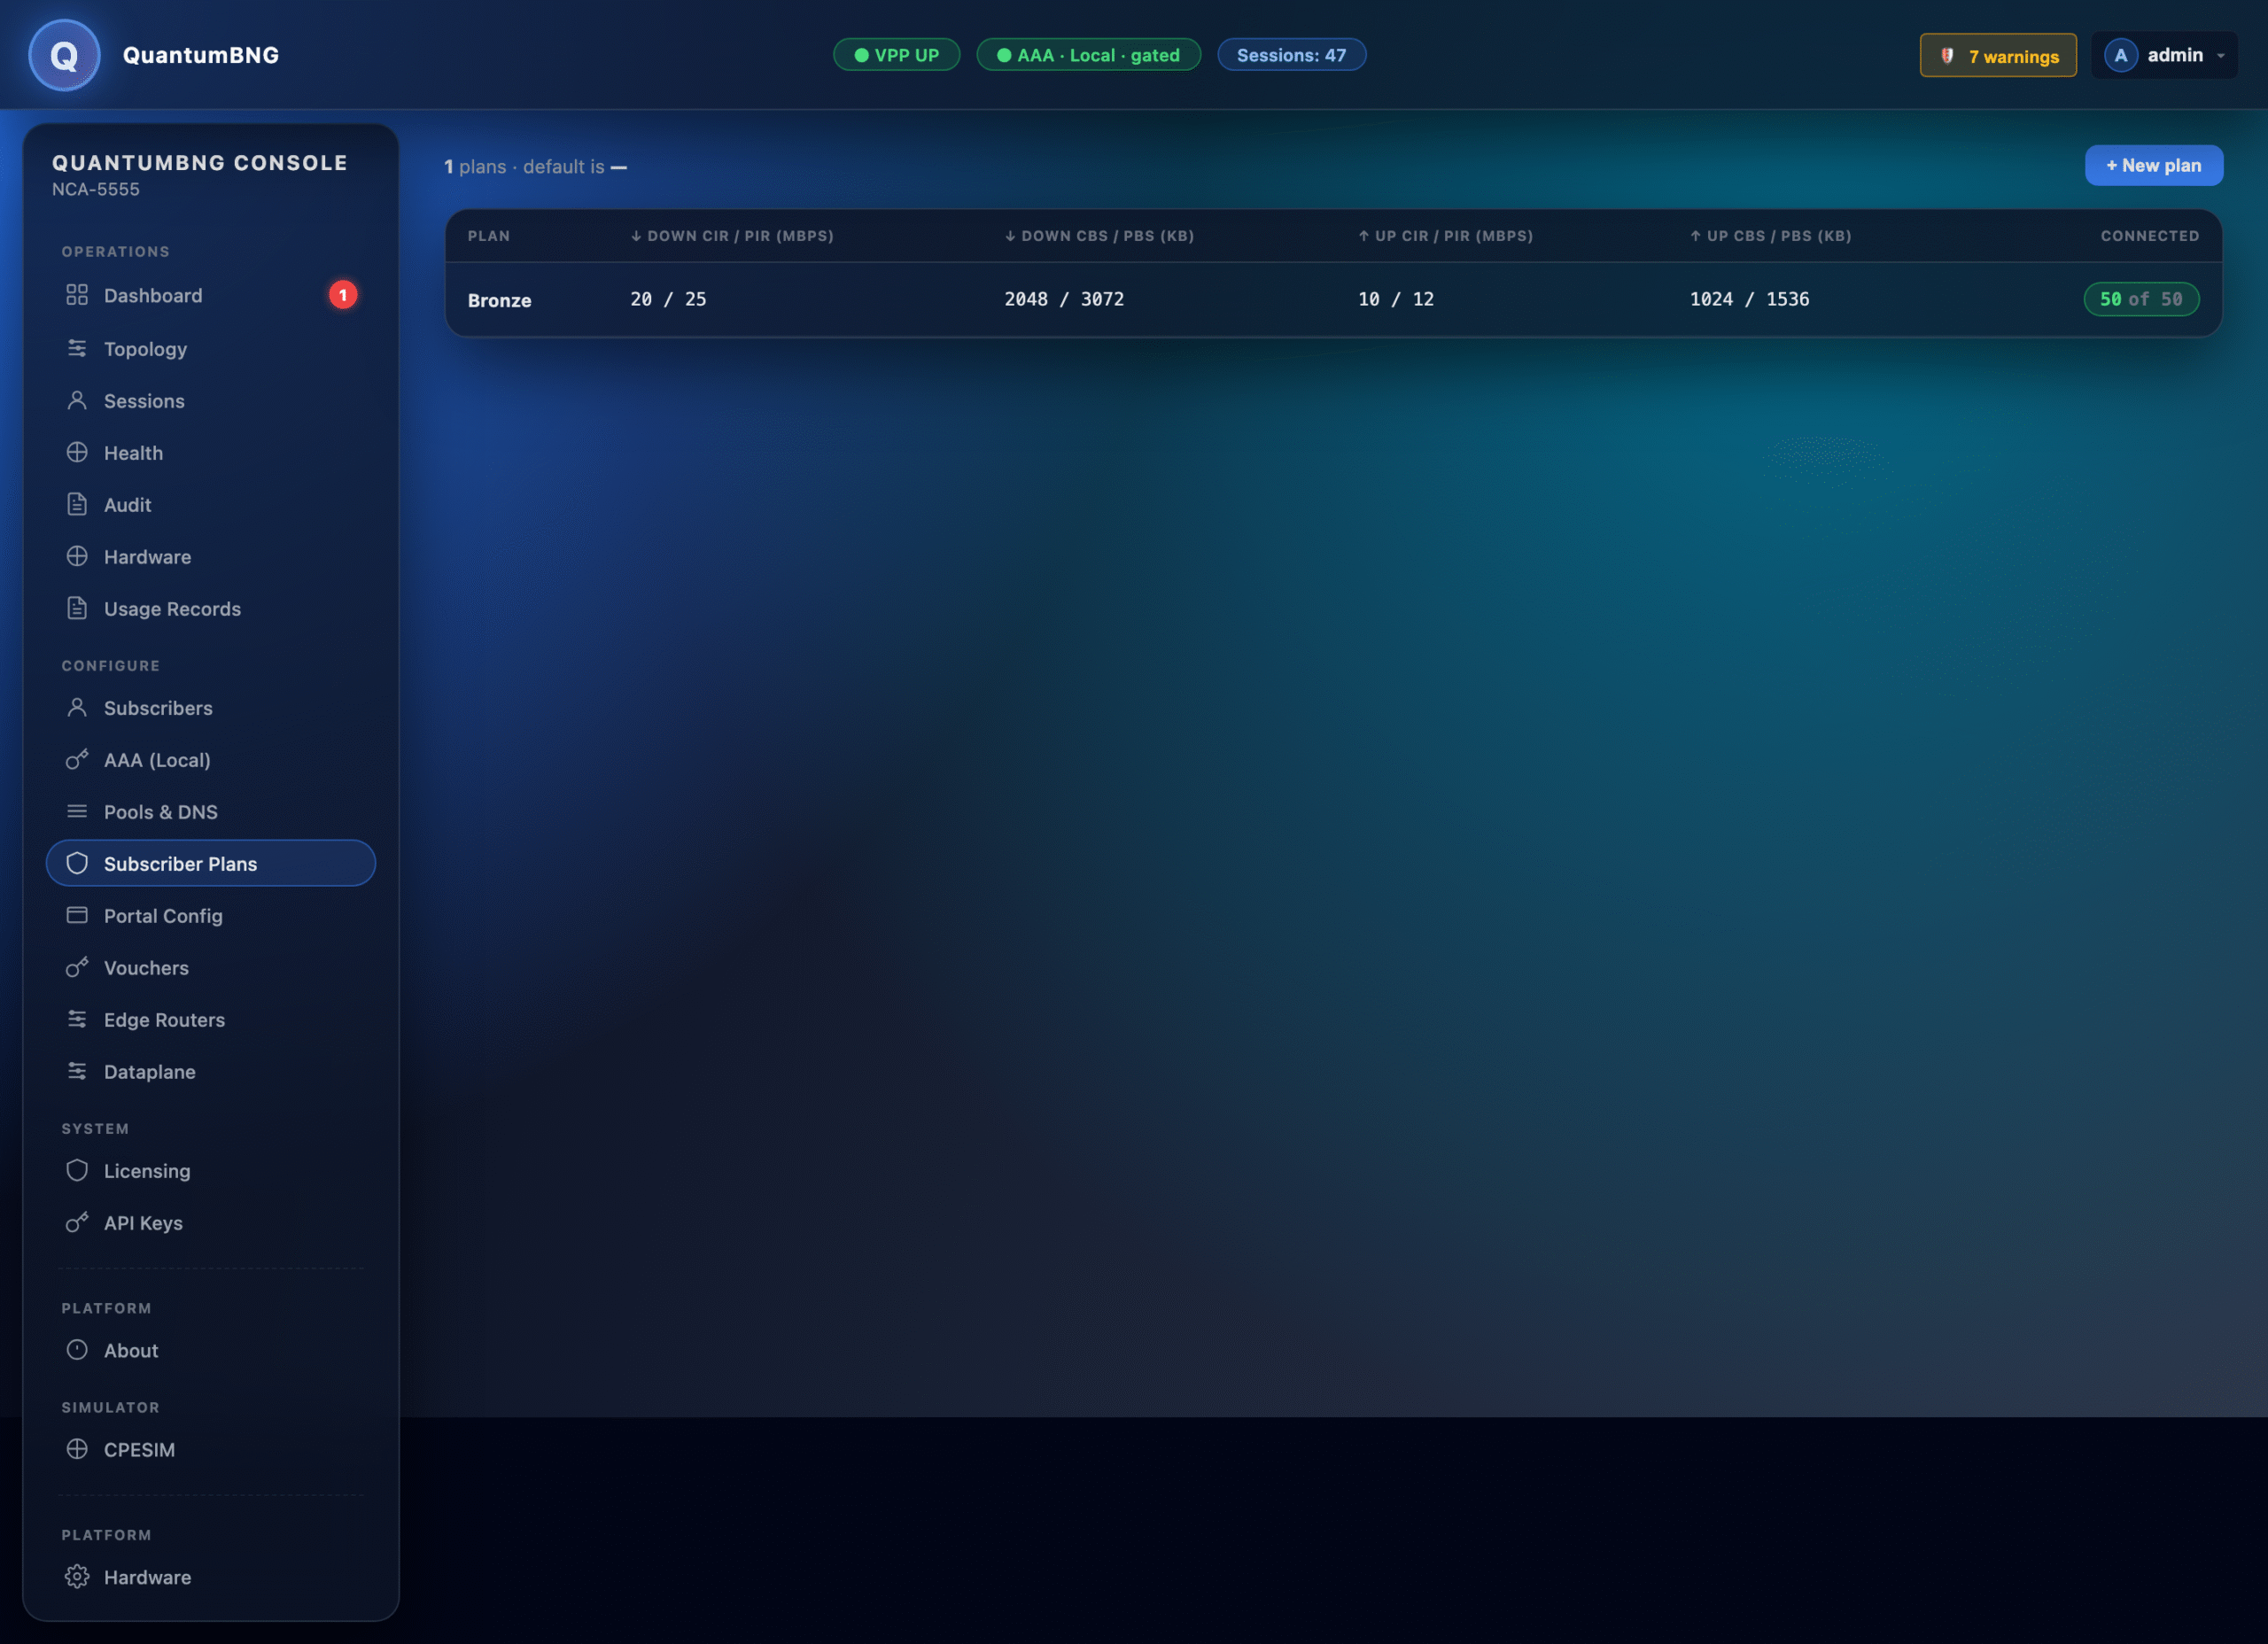
CIR = Committed Information Rate (guaranteed minimum, packets colored green). PIR = Peak Information Rate (burst ceiling, packets between CIR and PIR colored yellow). Packets above PIR are dropped (red).
*_bps fields in the API are BYTES per second. Multiply by 8 for bits/s (the webui shows Mbps).
Changes to a plan take effect on the next subscriber onboard OR when you click Re-rate active sessions to push the change immediately.
Portal Config
Captive portal setup — the portal_ip that the BNG hands to unprovisioned subscribers, the portal page's branding, and the vouchers page (if you use voucher-based auth instead of pure username/password).
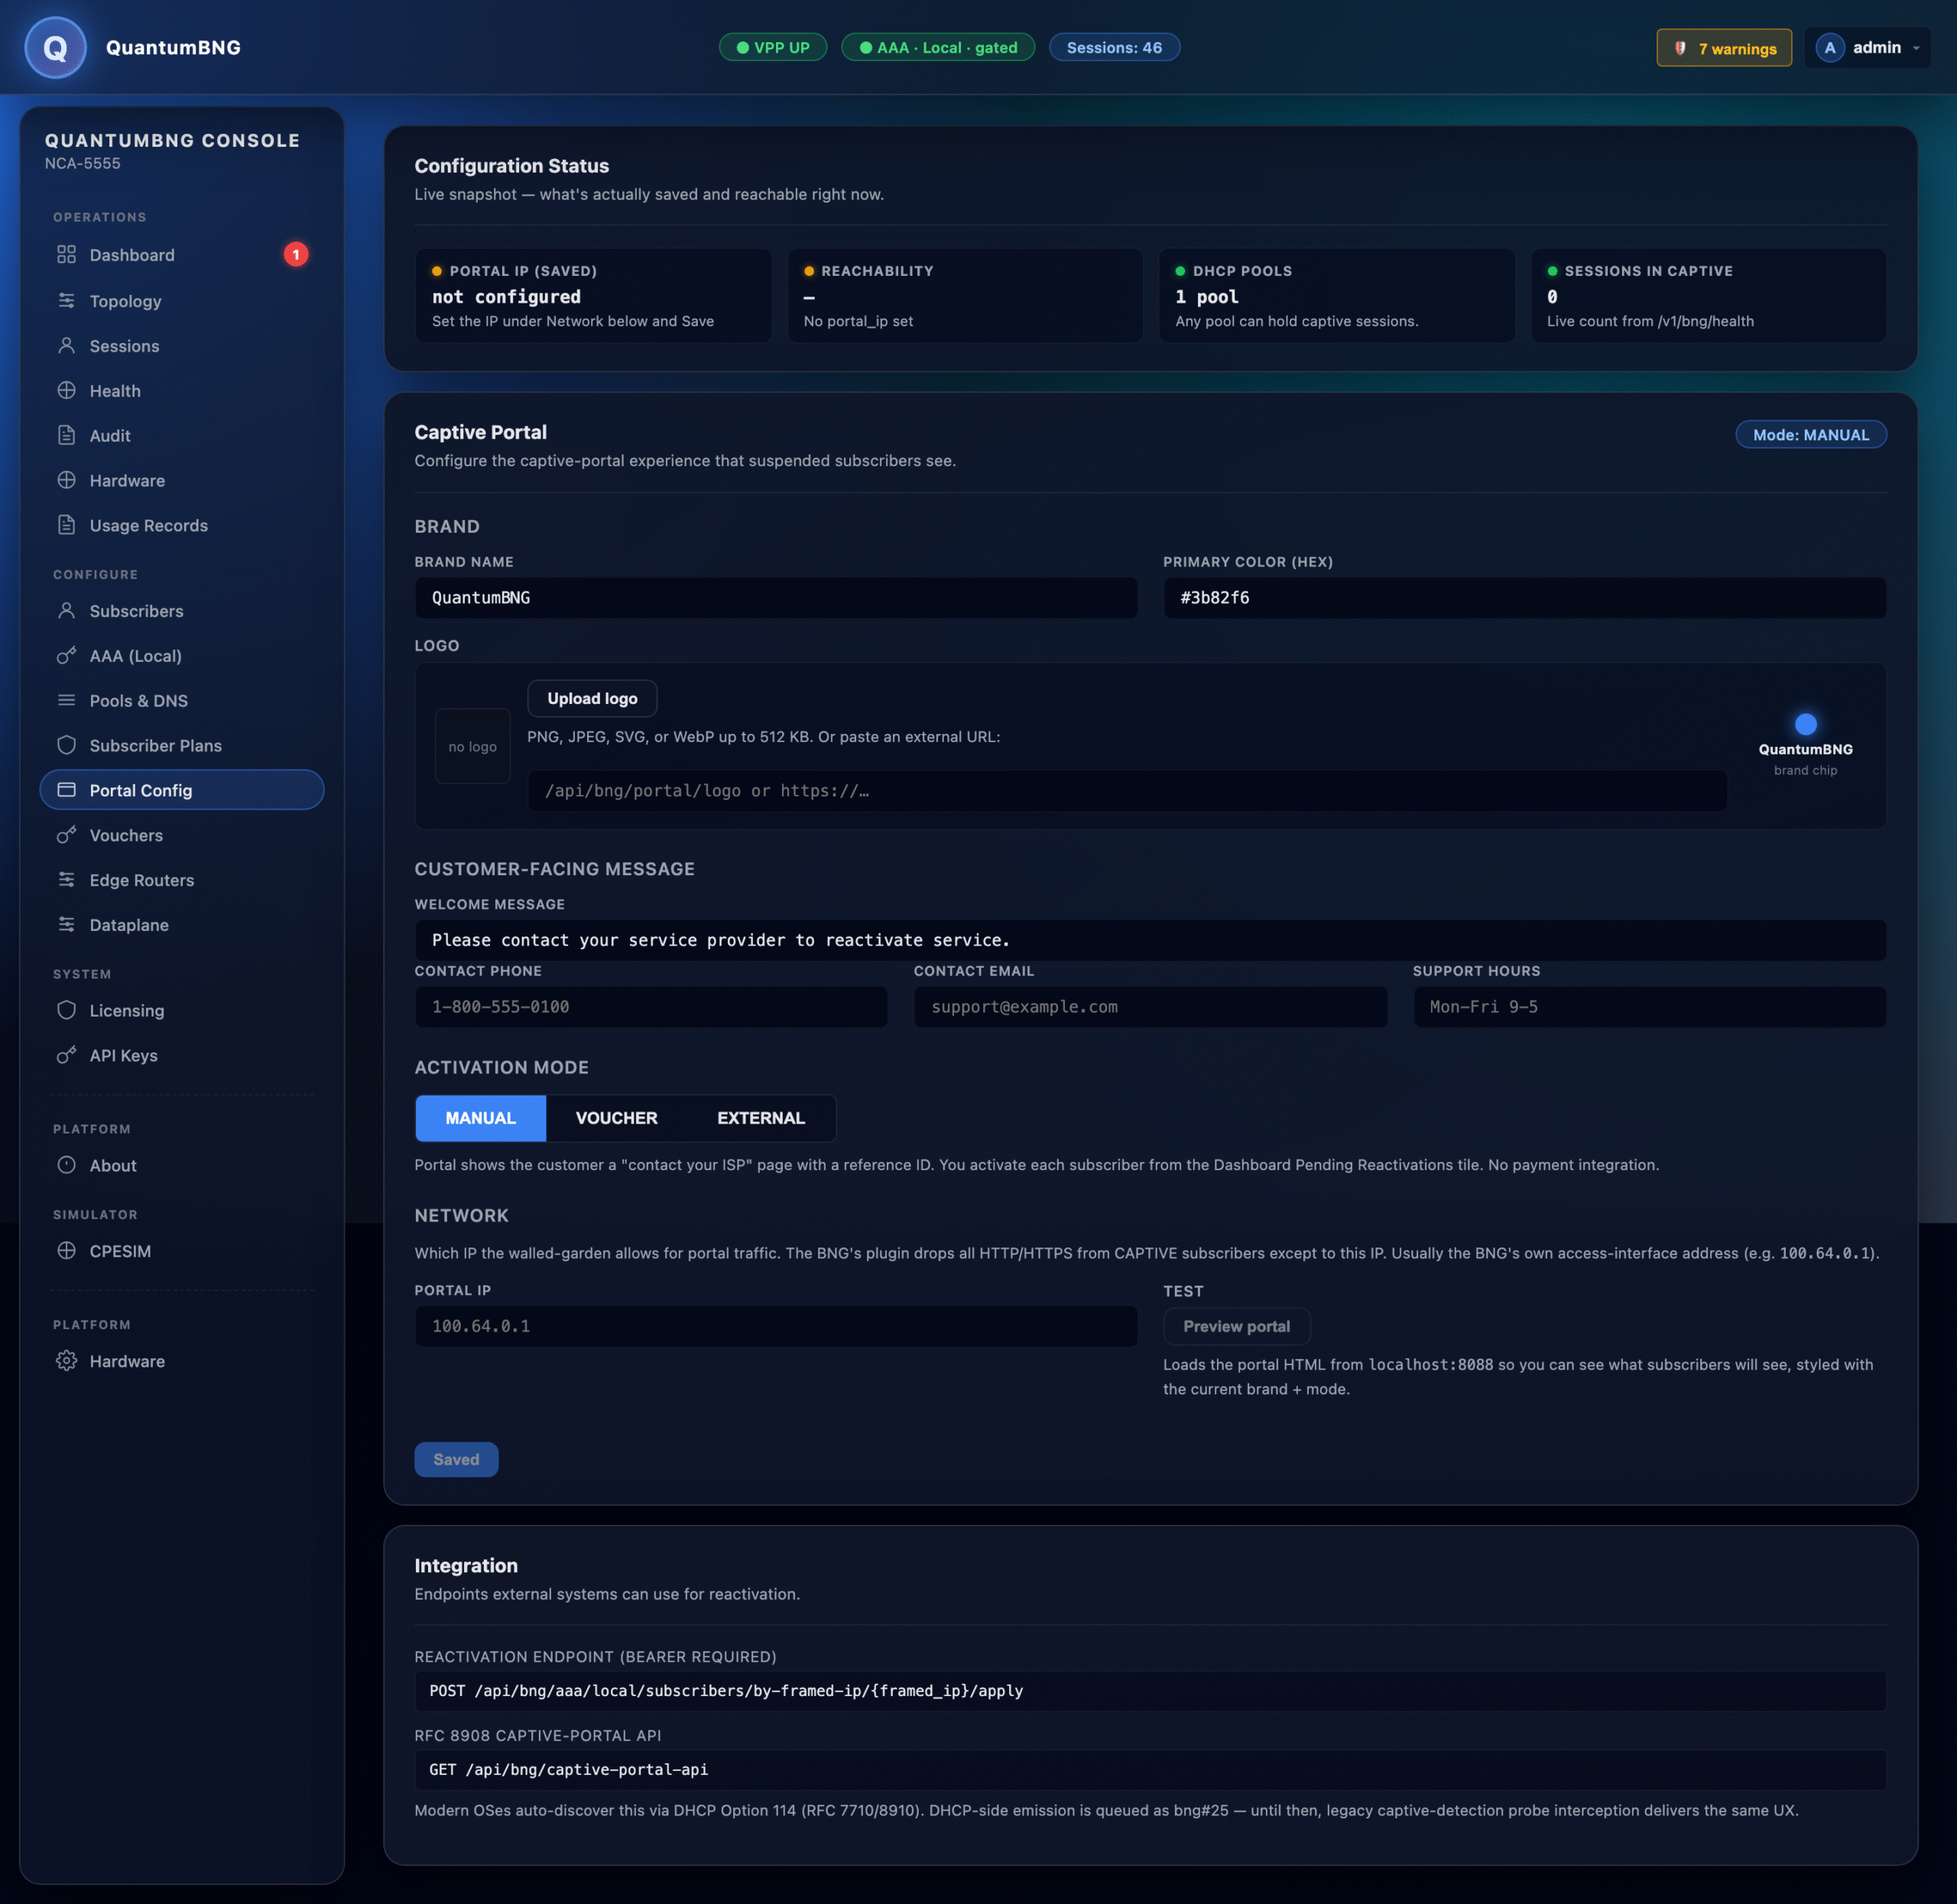
If portal_ip is unset, unprovisioned DHCP DISCOVERs get silently dropped in gated mode. You'll see this in the controller log as captive required but no captive portal IP configured, dropping.
Dataplane
VPP-level knobs — interface state, RX/TX queue counts, RSS, worker placement, hugepage size, IOMMU groups.
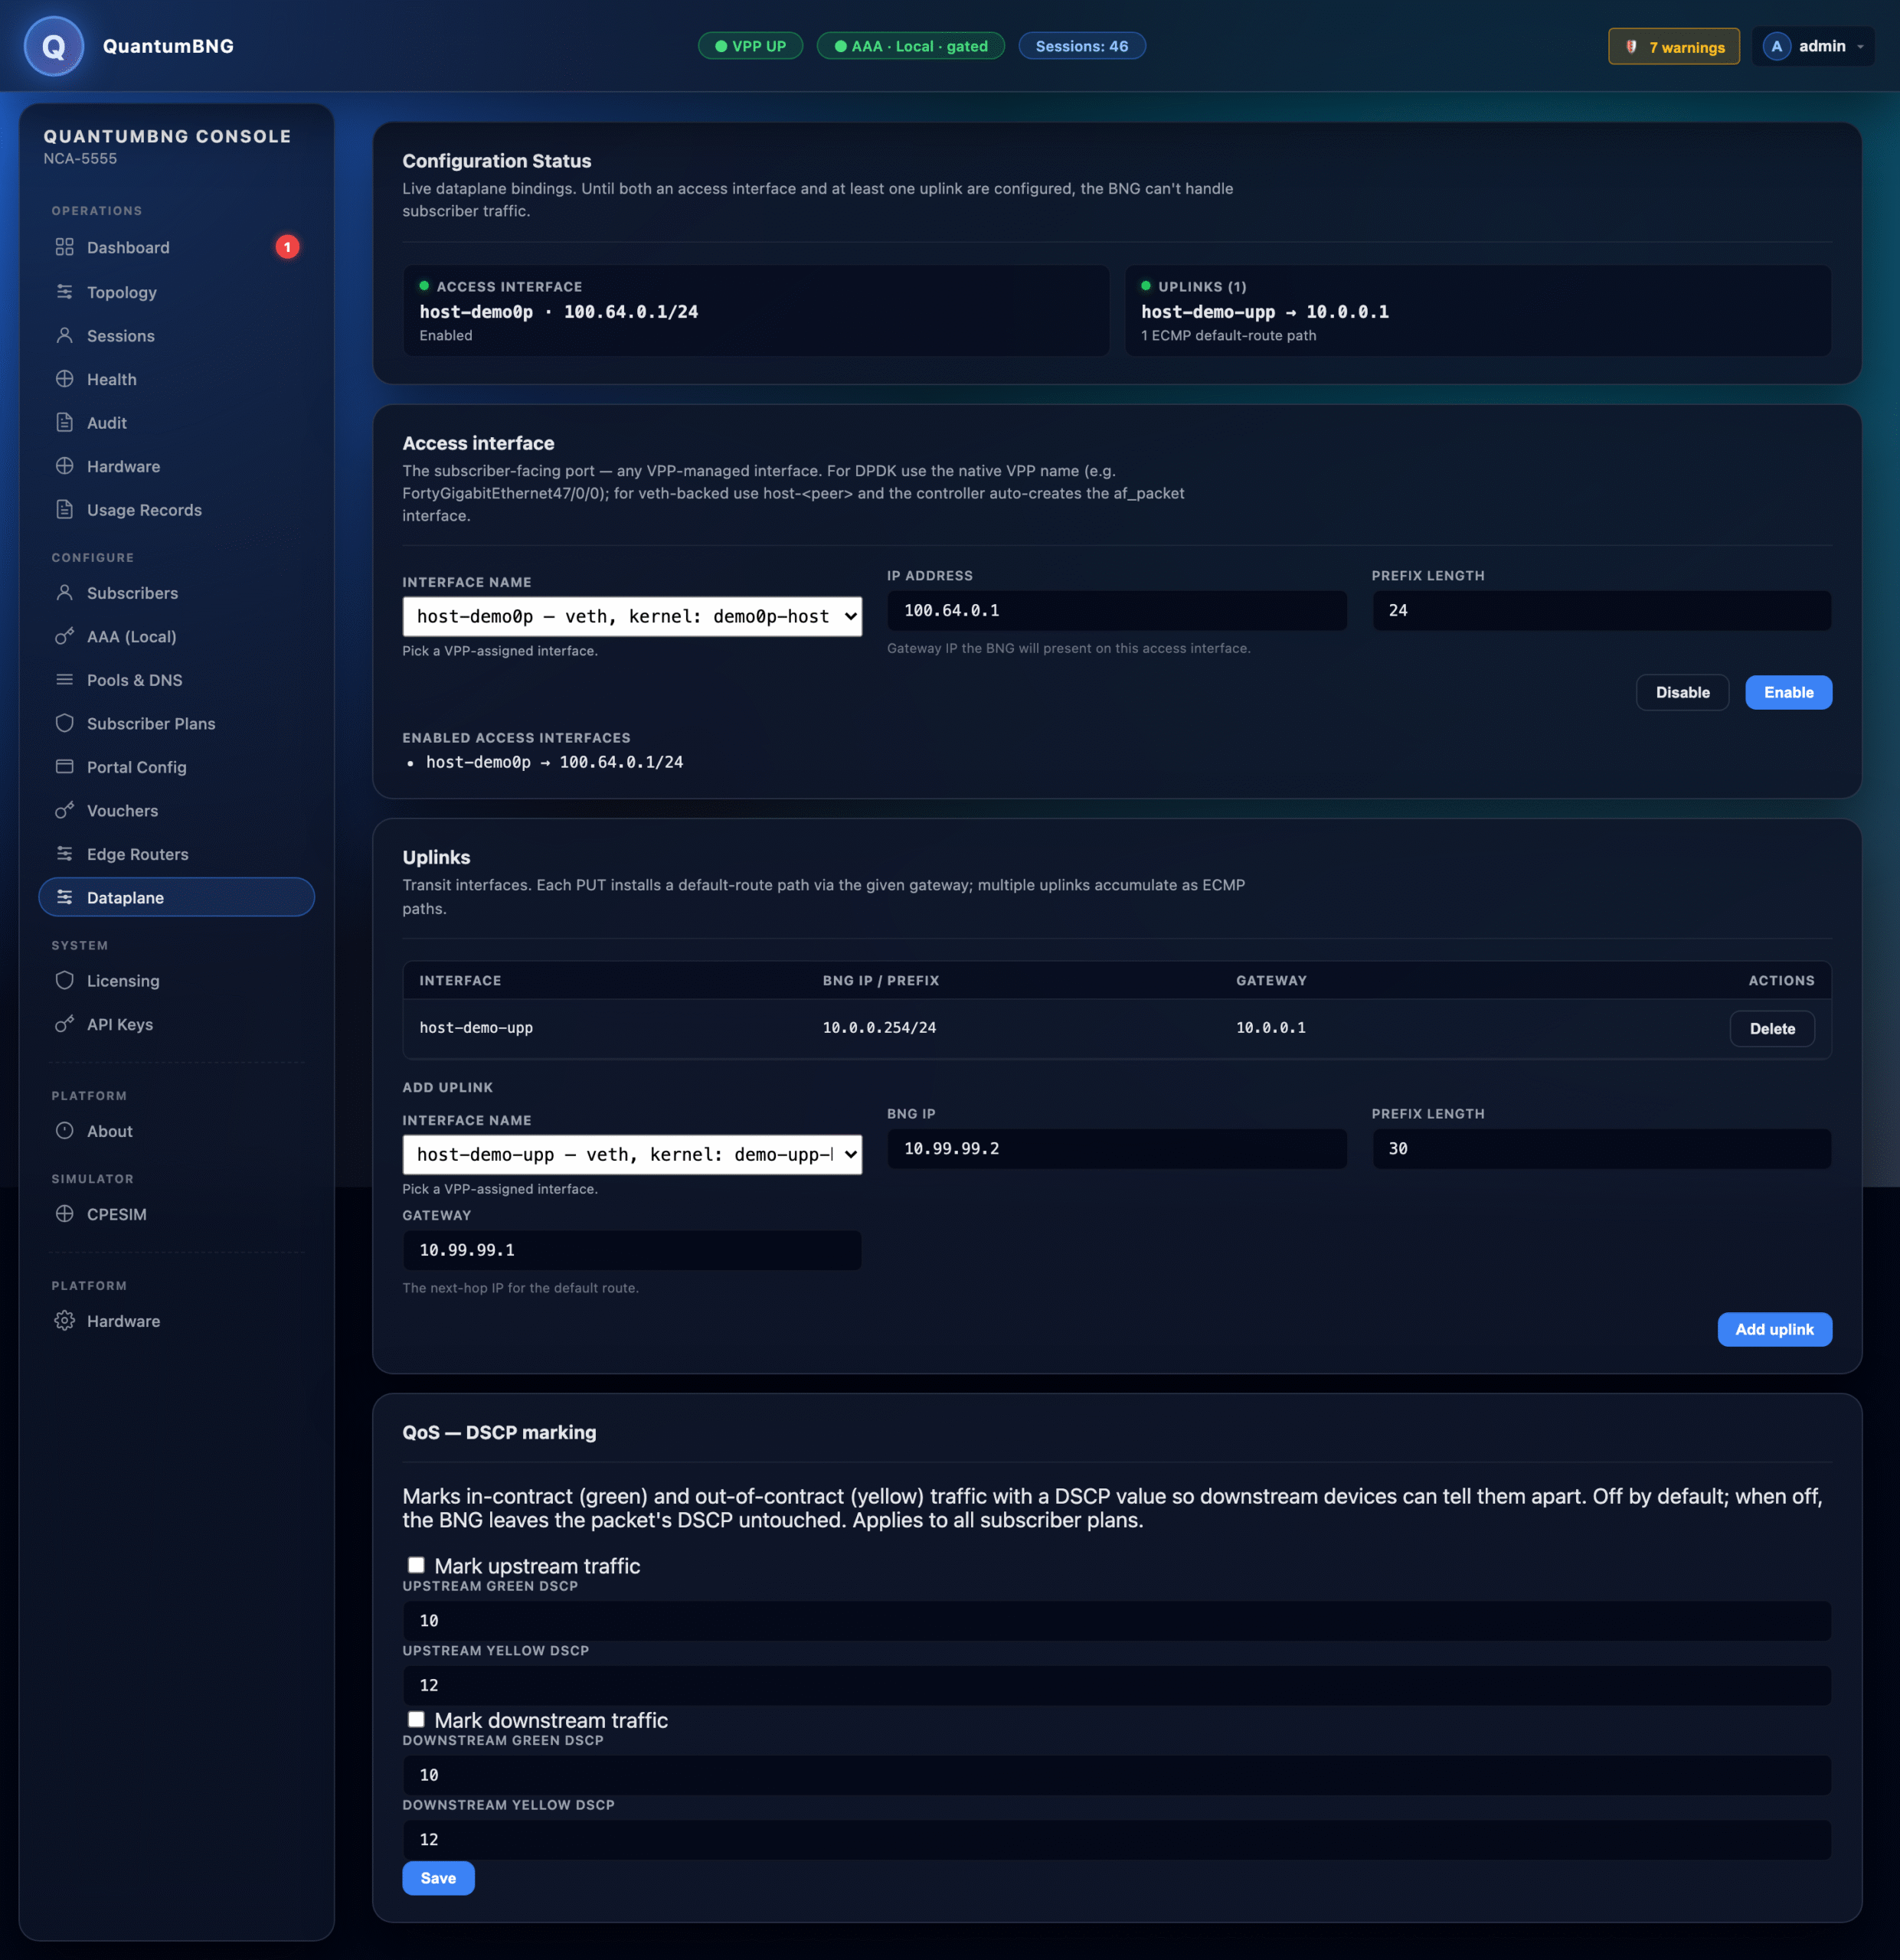
Most operators never touch this page — the wizard's defaults are correct for most
single-NIC boxes. Edit if you're doing custom NUMA pinning, split-NIC access/uplink
topologies, or dpdk driver overrides (e.g. vlan-strip).
DSCP marking policy. New in 1.3.0: the per-subscriber policer can DSCP-mark
out-of-contract ("yellow") traffic as AF11 on both the upstream and downstream paths,
so downstream devices can tell in-contract from out-of-contract packets. Previously
yellow was counted but forwarded byte-identical to green. Green and red behaviour is
unchanged — red is still dropped. The Dashboard's QoS panel captions whichever state is
active.
Edge Routers
For deployments where the BNG faces multiple edge routers (e.g., separate business/residential upstream), list them here with their public IPs and next-hop configs. The topology page uses this list to draw the WAN-side of the map.
Licensing
Shows the session capacity in force, and the activation flow for raising it.
The free tier needs nothing. It is included with every install, requires no
licence and no TPM, and caps concurrent sessions at 1,000. That is every box
today, and for most operators this page is informational.
This page is groundwork in 1.3.0. Capacity licensing is being staged ahead
of its 1.4.0 launch: the controller side landed this cycle and the console side
is not finished. The page cannot read licence status or the machine fingerprint
on a 1.3.0 box — it shows an error instead. If you need to raise capacity now,
the command-line flow below is fully supported.
Raising the cap — four steps, run on the box itself for the first two:
-
Capture the fingerprint, which identifies this specific machine:
quantum-license-fingerprint
# sha256:276486e444e3569cbdc3d03bea7441dfc57eb12d6e561a52bb69106a66703dea
Add
--jsonif your vendor contact also wants the SMBIOS UUID. The value is a
hash of the TPM endorsement key and carries no secrets, so email is fine. -
Send it to Bluedot (info@bluedot-insight.com) with the capacity you need and
your customer identifier. You receive a.licfile signed to that fingerprint —
it will not install on any other machine. -
Install it:
quantum-license-install /tmp/your-licence.lic -
Verify:
quantum-license-statusThe dashboard's capacity indicator picks up the new limit immediately — no
restart.
Capacity activation requires a TPM 2.0 device at /dev/tpmrm0.
Licensing gates capacity only, never function. A licence that expires or fails
verification reverts the box to the free-tier cap; it does not stop forwarding
traffic.
Usage Records
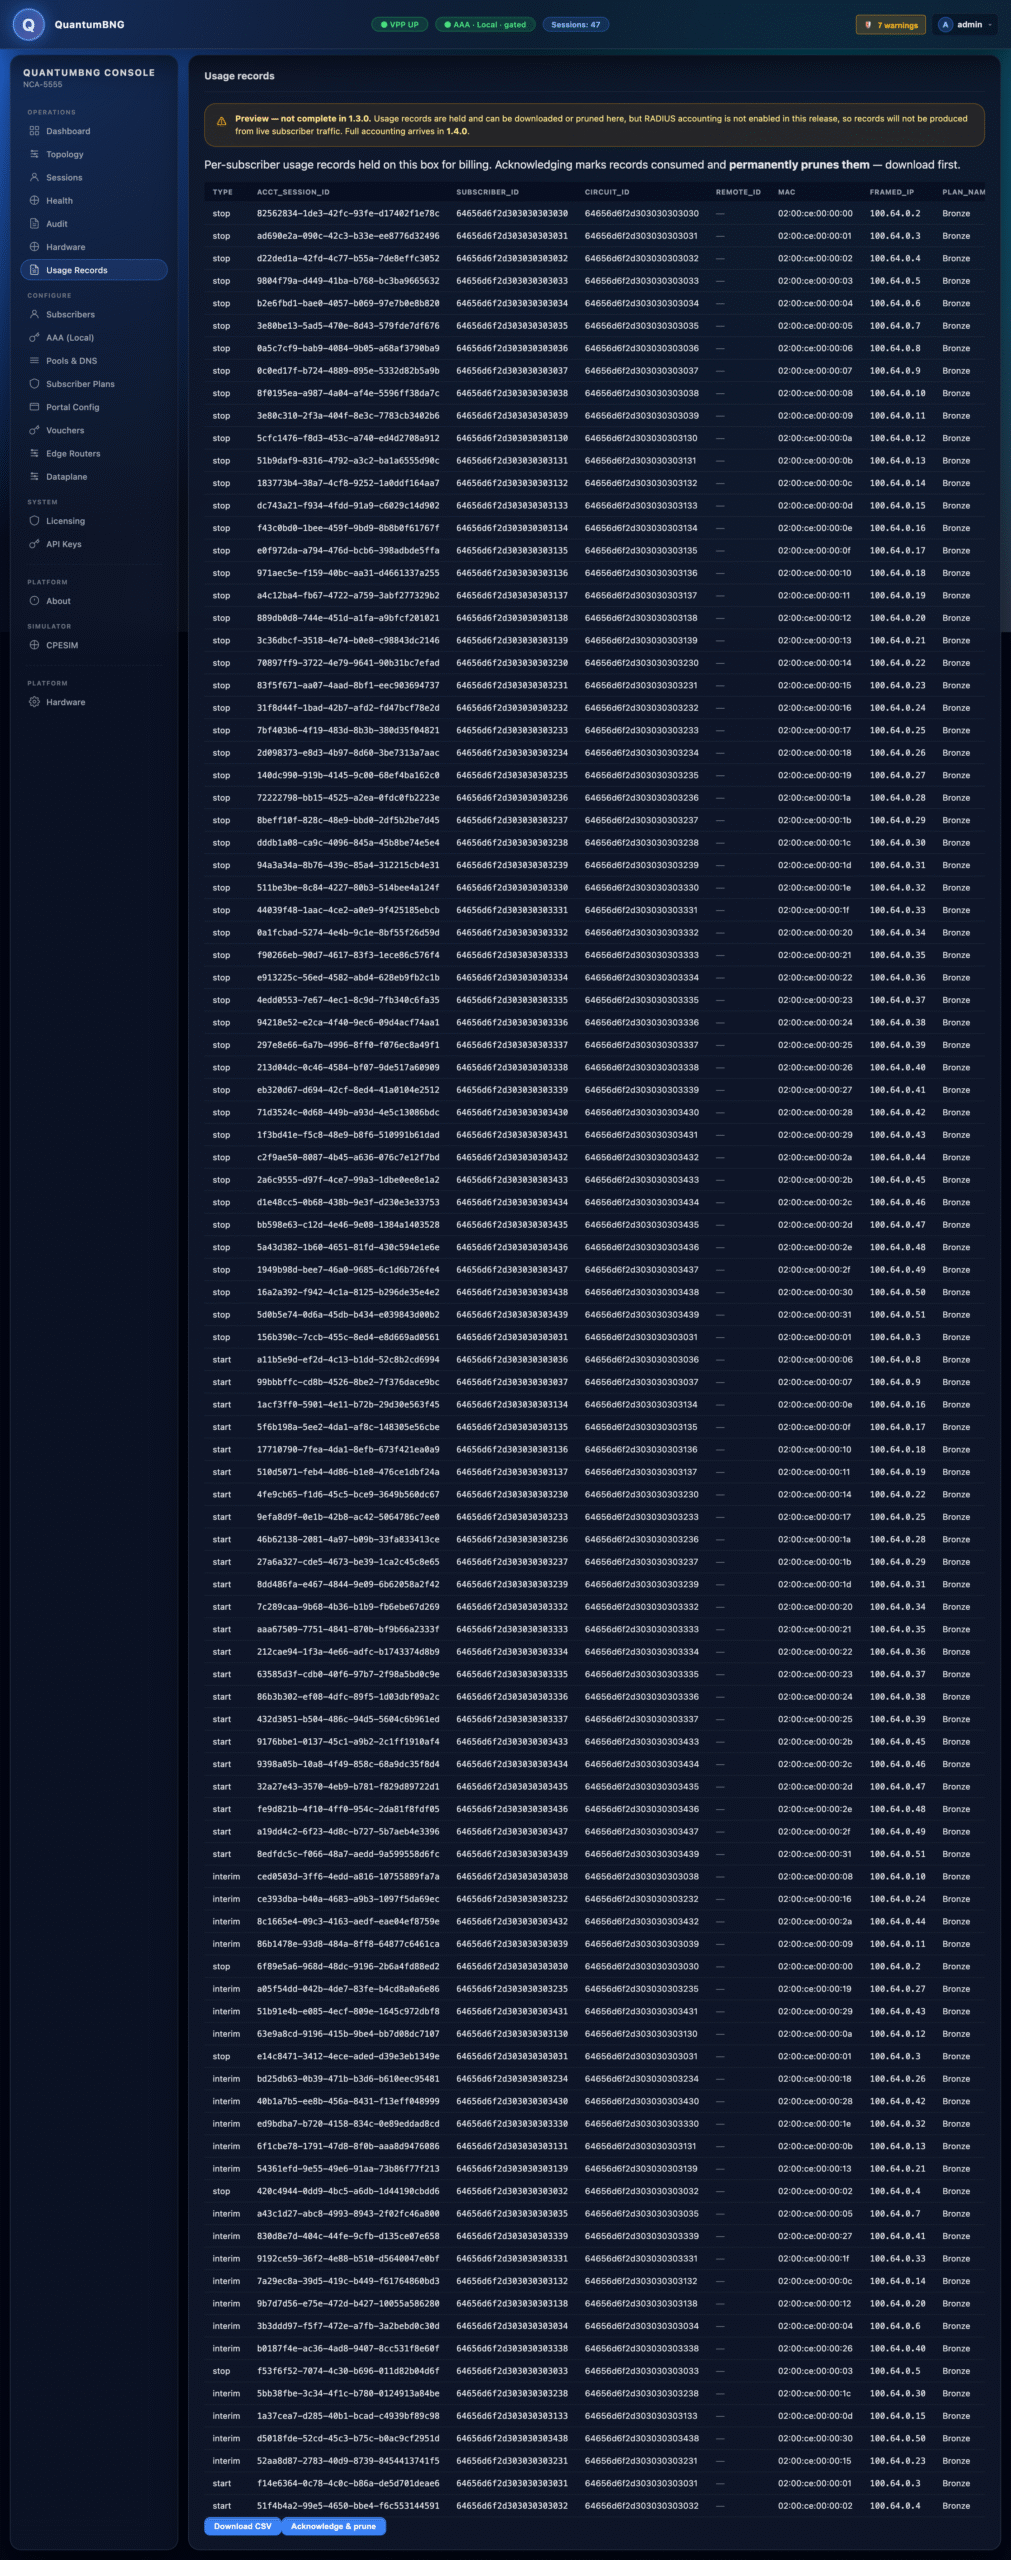
Per-subscriber usage records held on the box for billing — the local-AAA analogue of
RADIUS accounting. Each row carries the accounting type (start / interim / stop),
session and circuit IDs, MAC, framed IP and plan.
This is different from the live counters on the Dashboard and Sessions pages: those are
gauges showing what is happening now, and they reset. These persist so they can be
exported and reconciled later.
Read the preview banner on the page before you build against this. In 1.3.0 records
are held, downloadable and prunable, but RADIUS accounting is not enabled — so records
are not produced from live subscriber traffic. Full accounting arrives in 1.4.0.
Acknowledging deletes. The page's action is Acknowledge & prune: it marks records
consumed and permanently removes them. There is no undo and no second copy. Use
Download CSV first, every time — the CSV is the only thing that survives the
acknowledgement.
Acknowledge only through the records you have actually stored. The control acknowledges
through the highest sequence shown on the page rather than the whole spool, so a spool
larger than one page is consumed a page at a time rather than in one sweep — which is the
behaviour you want, because the alternative silently discards everything between the page
you read and the end of the spool.
About + Toybox
Version info + the Toybox plugin registry. Toybox is where operators install optional add-on modules — currently just CPESIM (the built-in subscriber simulator).
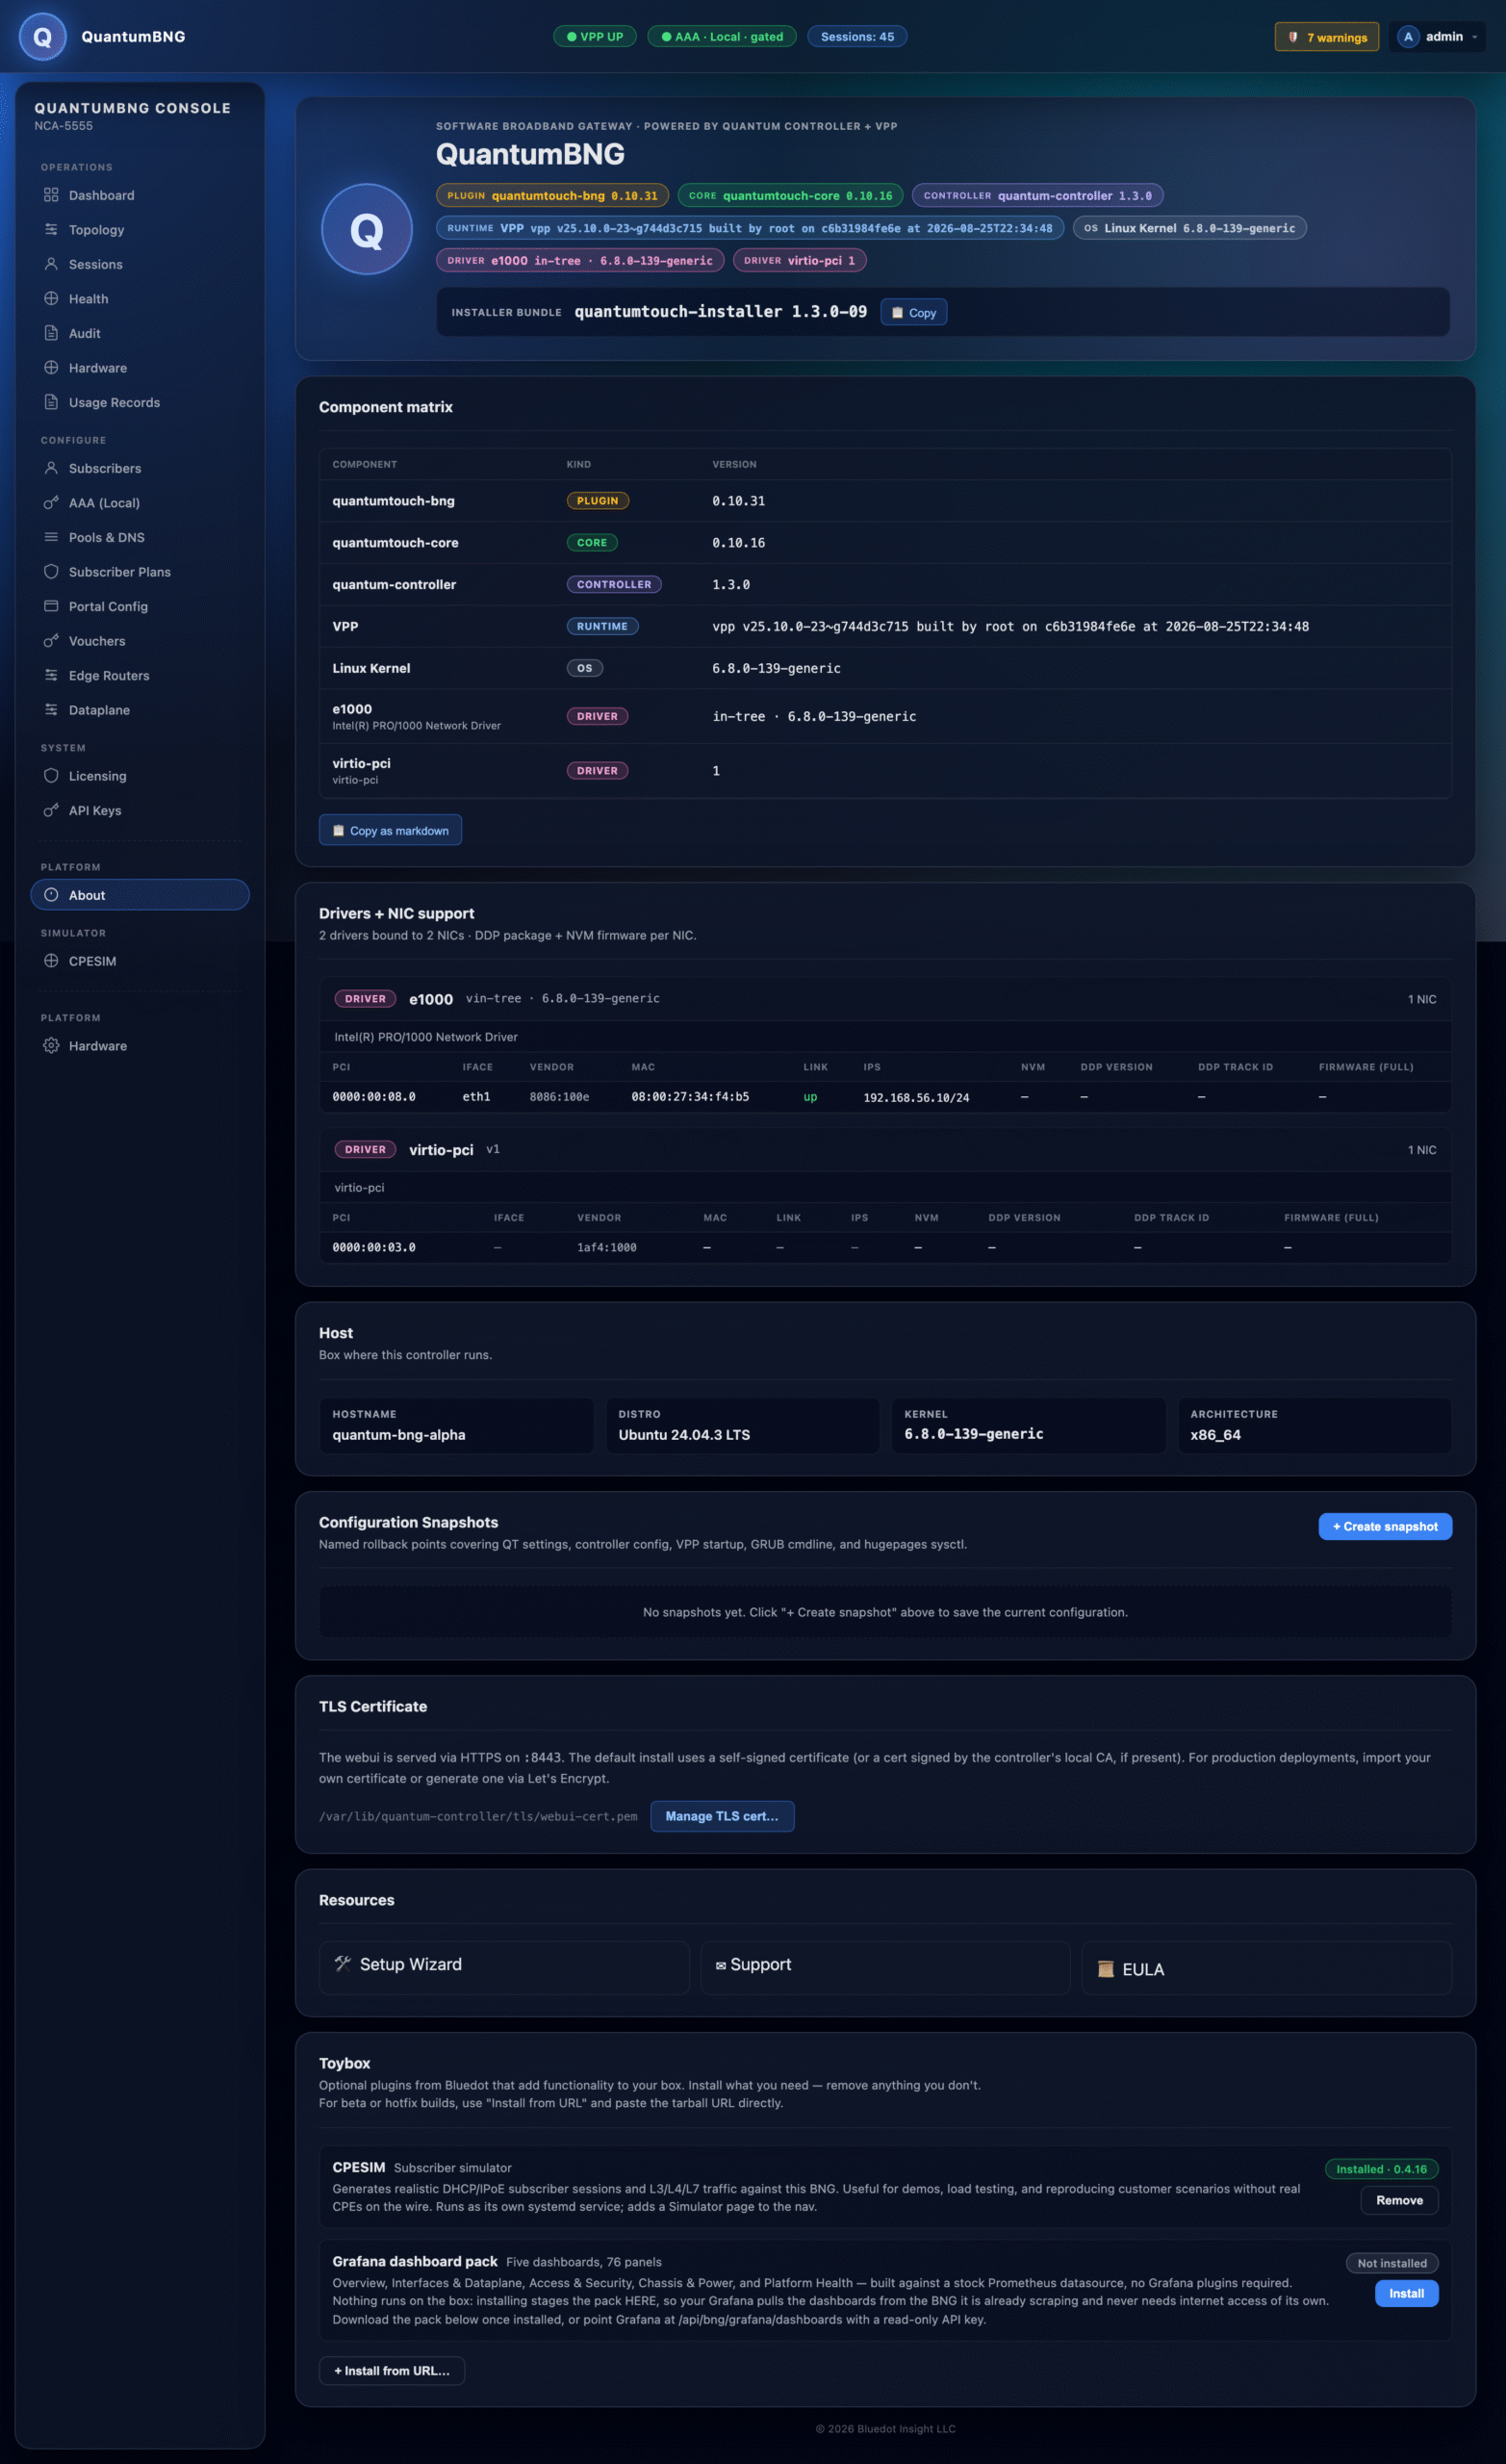
Each plugin row shows: install status, installed version, install/remove button.
Install from URL lets you install a beta/hotfix build without waiting for a full BNG
release.
As of 1.3.0 Toybox carries two plugins: CPESIM and the Grafana dashboard pack — a
curated set of BNG dashboards you can preview before wiring anything up, with
multi-select download. Pair it with a metrics-only API key (see
API Keys) so the Grafana instance gets a key scoped to reads rather than
broad access.
API Keys
The webui's key store. Mint per-operator keys (recommended over sharing the bootstrap admin key), scope them to roles (read_only, read_write, admin_only, metrics_scraper), set expiry.
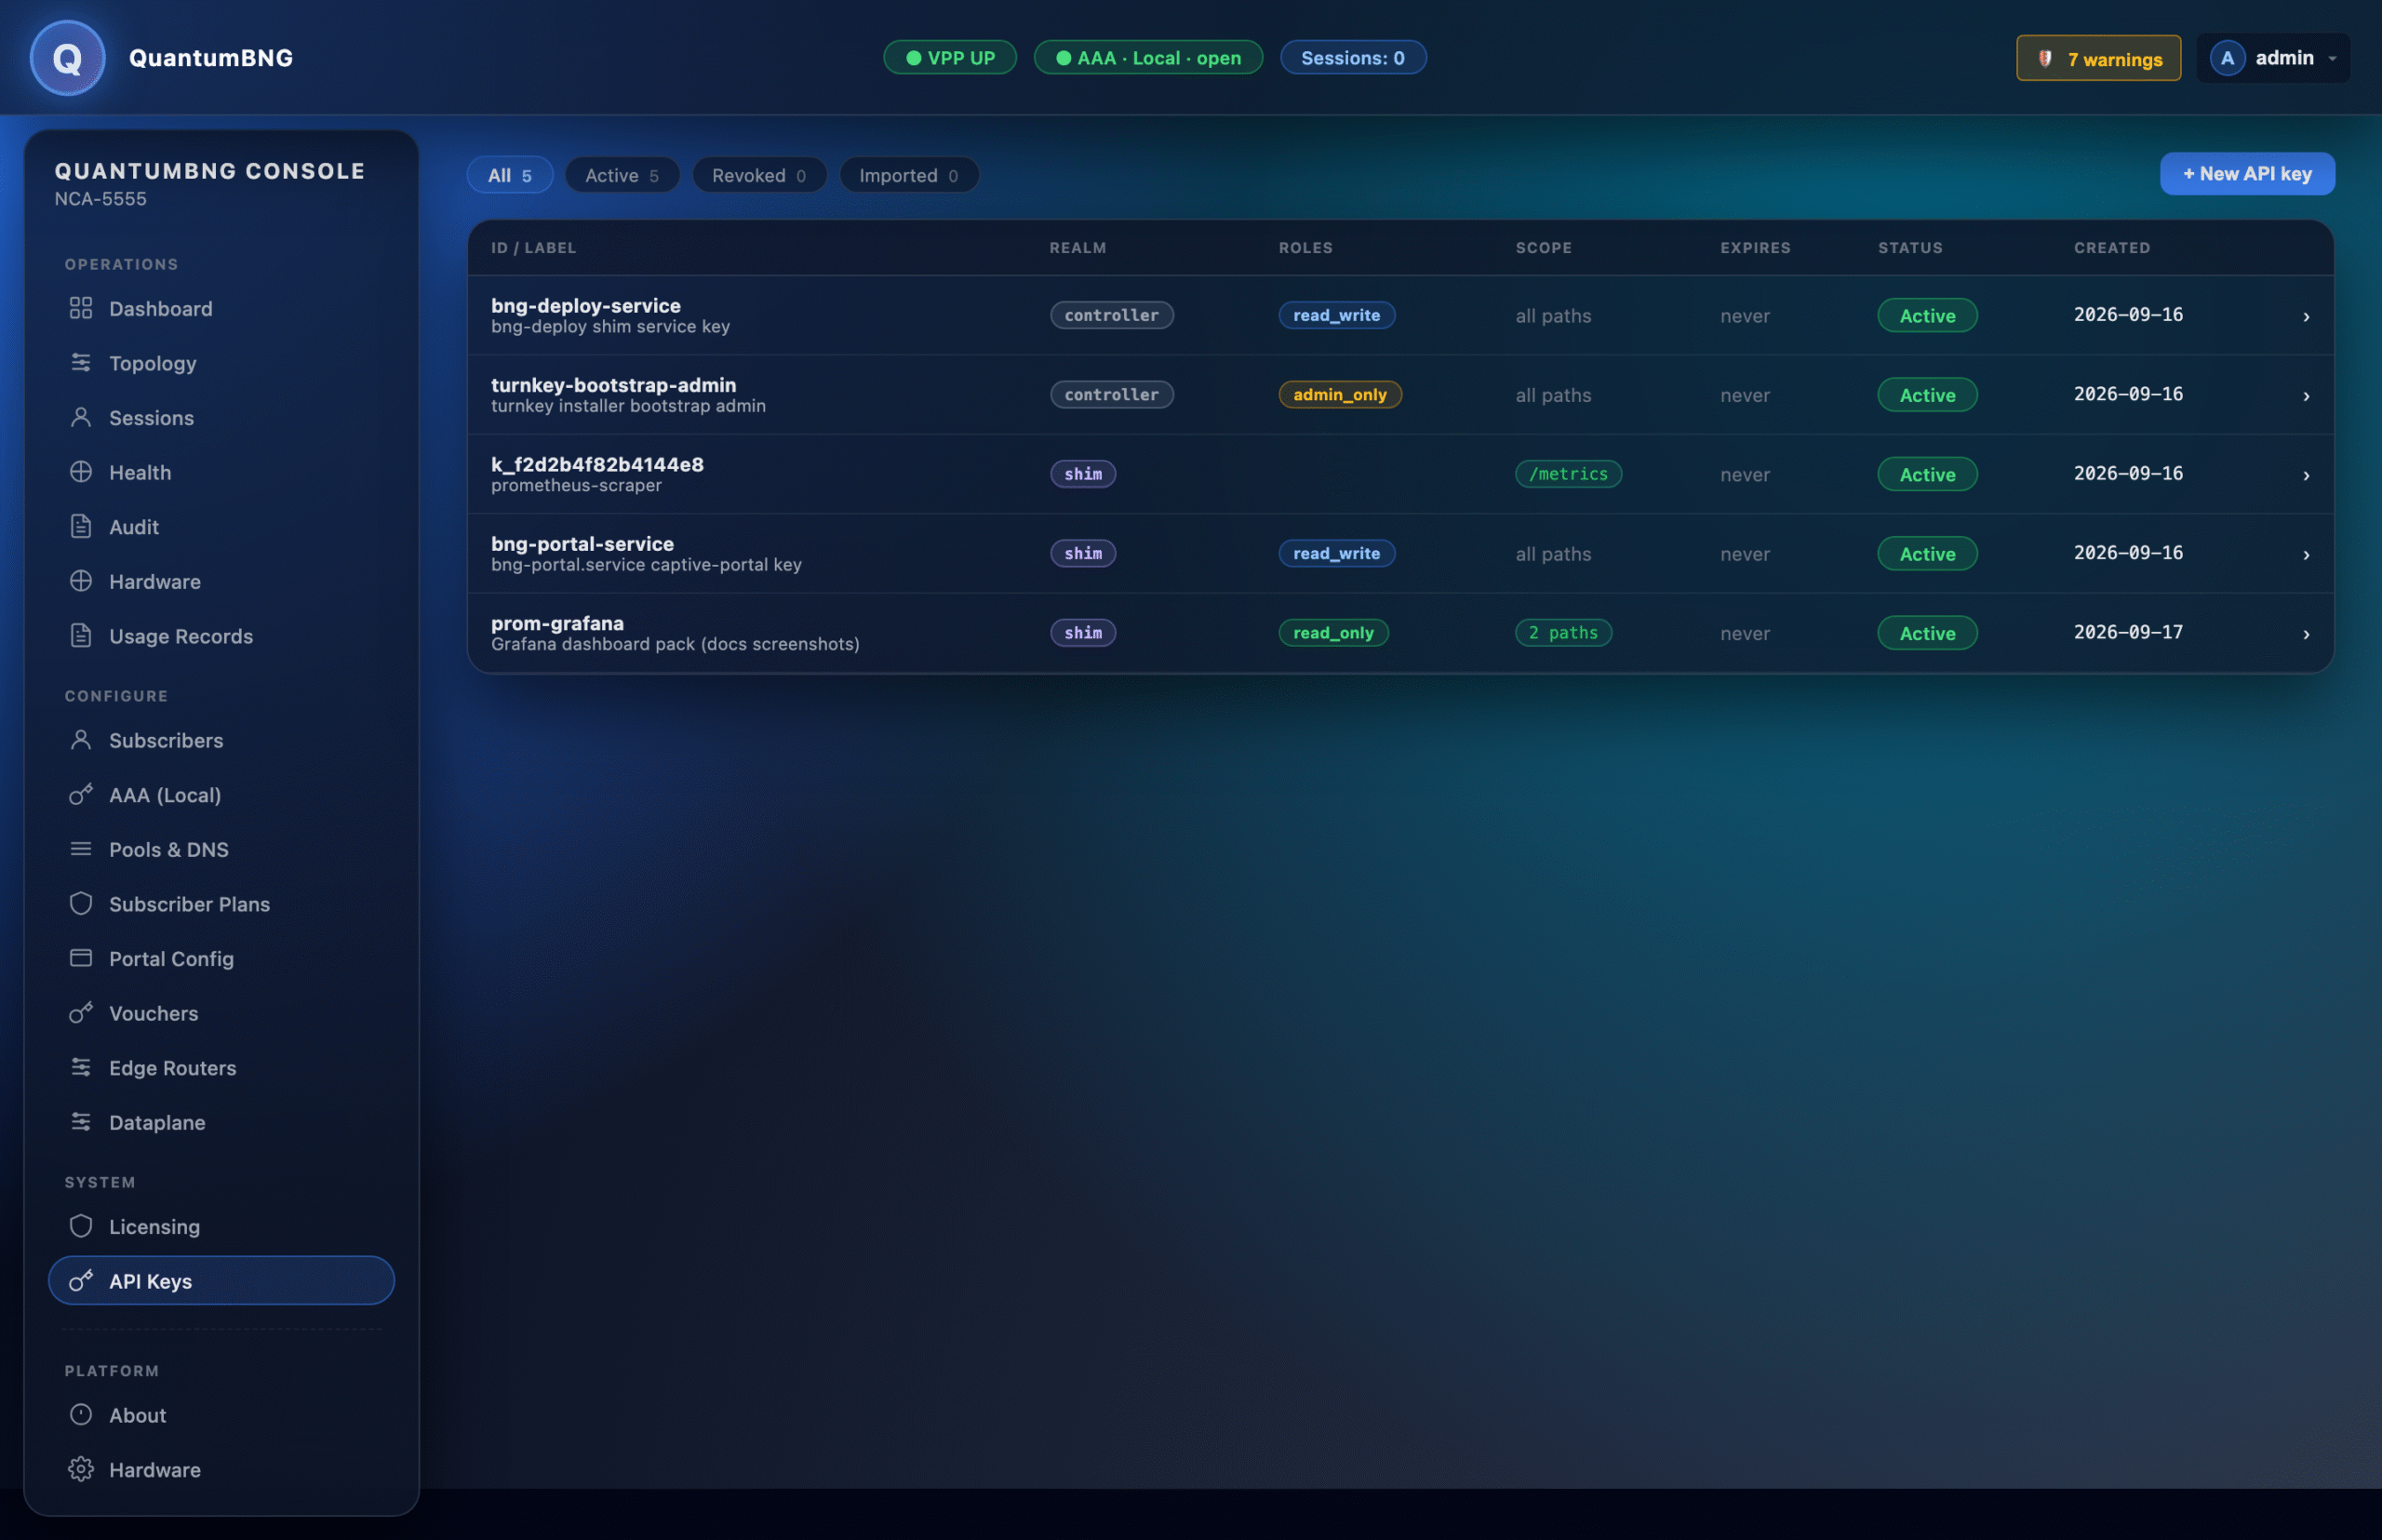
The metrics_scraper role is scoped to /metrics only and is what Prometheus uses. Rotate with sudo /opt/bng-deploy/bin/qt-scrape-token-rotate.
CPESIM
The subscriber simulator plugin's control page. Only visible if you installed CPESIM via Toybox.
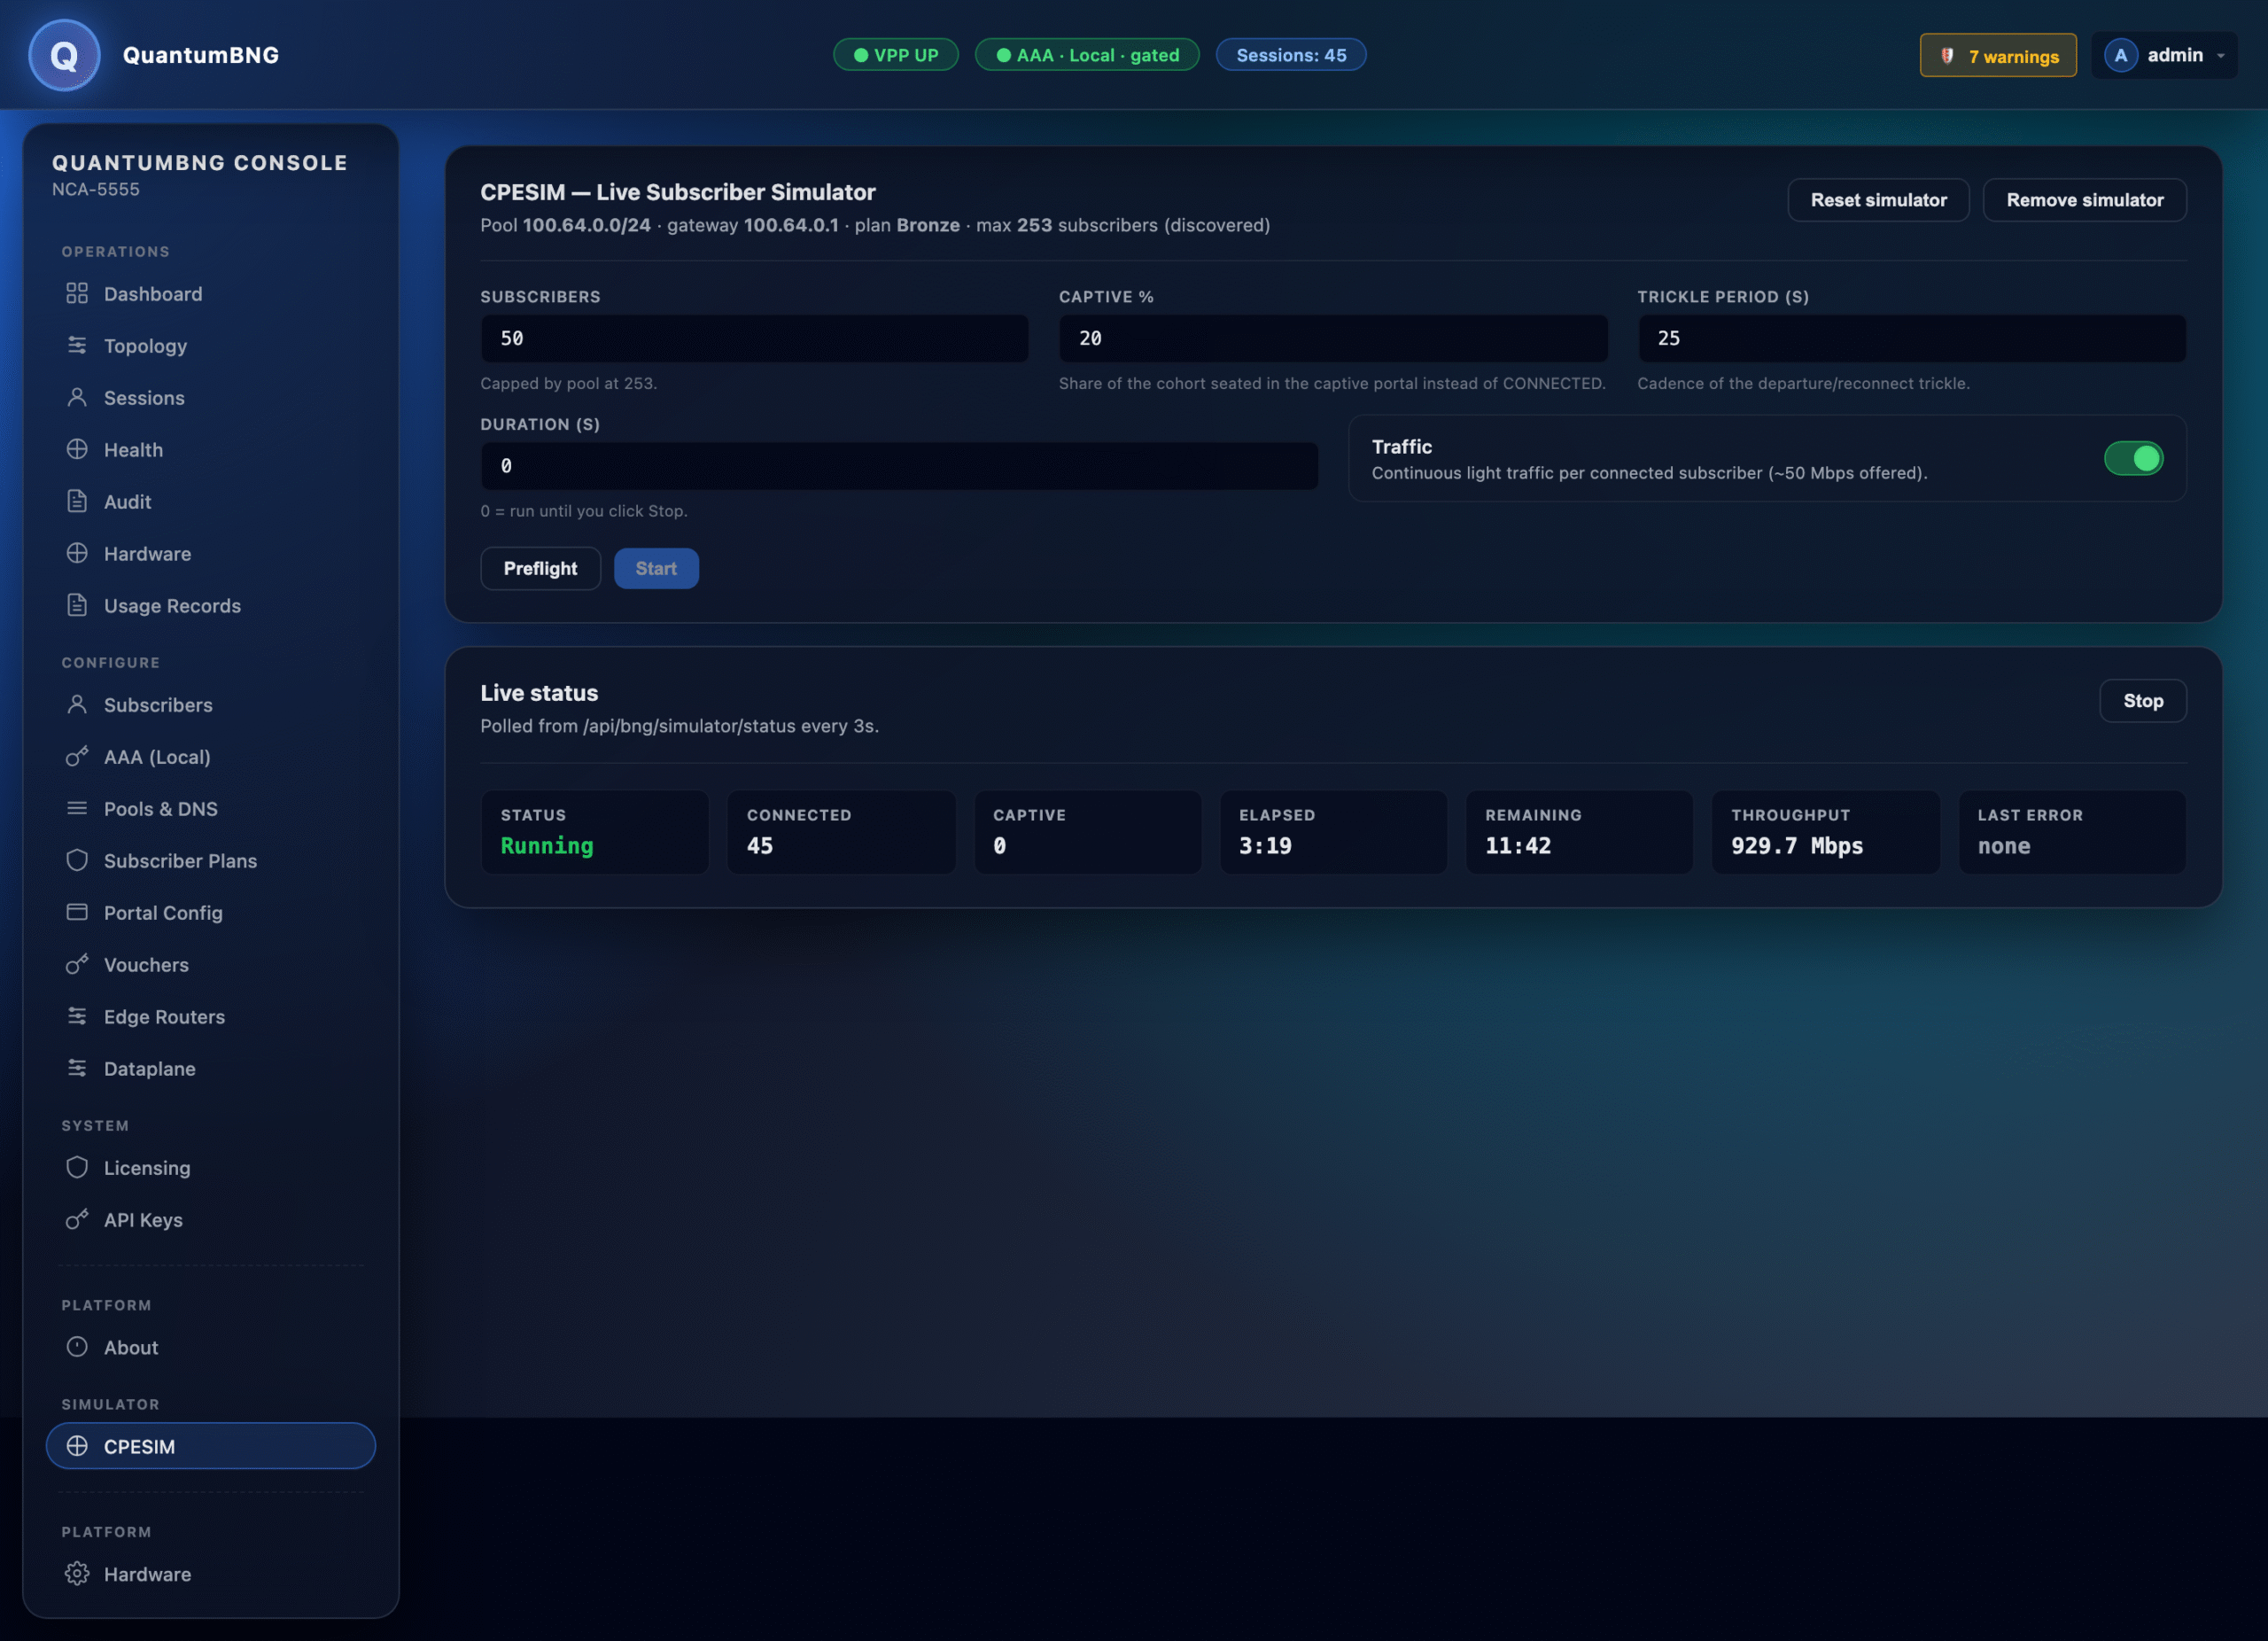
Start — spawn N simulated subscribers doing real DHCP + AAA + HTTP video traffic through your BNG. Stop — clean teardown. Reset simulator (admin-only) — recovery button that clears wedged state and restarts the whole CPESIM engine.
Configuration: subscribers count, captive fraction, duration. Sensible defaults are baked in — click Start and go.
Common operator tasks
Add a new rate plan
- Subscriber Plans → Add plan
- Name it, set the four
*_bpsfields (BYTES/s — multiply your Mbps target by 125000) - Save. New onboards will pick it up; existing sessions keep their current plan until you either change their individual subscriber record or re-rate.
Move a subscriber to a different plan
- Subscribers → find the row → click to edit
- Change Plan dropdown → Save
- In Sessions, find their active session → drawer → Re-rate now (avoids waiting until their next reconnect)
Suspend a subscriber
- Subscribers → find the row → set Status to
suspended - In Sessions, find the active session → drawer → Disconnect. The next time they reconnect, gated AAA will send them to captive.
Add a new DHCP pool
- Pools & DNS → Add pool
- Name, CIDR, lease time (default 3600s is fine), one or more DNS resolvers
- Save. If you want subscribers to prefer this pool, edit the plan(s) to reference it.
Rotate the metrics scrape token
sudo /opt/bng-deploy/bin/qt-scrape-token-rotateWrites the new token to /opt/quantumtouch/etc/scrape-token and reloads the Prometheus container. Point your monitoring scrape at the new value.
Enable HTTPS with a real cert (Let's Encrypt)
See letsencrypt-on-bng.md — walks through the ACME HTTP-01 challenge flow and cert renewal automation.
Backup and restore
Backup — writes an encrypted bundle of the user store, API keys, session store, and system config to a file:
sudo /opt/bng-deploy/bin/qt-auth-backup.sh /path/to/backup.tar.gz.encYou'll be prompted for a passphrase. Store both the file and the passphrase somewhere durable.
Restore on a fresh install:
sudo /opt/bng-deploy/bin/qt-auth-restore.sh /path/to/backup.tar.gz.encThe restore replaces /opt/bng-deploy/data/{users,api_keys,sessions}.json and restarts bng-deploy. It does NOT restore subscribers/plans/pools — those live in the controller's controller.db and roll over from install to install; snapshot via About → Snapshot in the webui.
Key rotation
| Key type | Command | When to rotate |
|---|---|---|
| Bootstrap admin API key | sudo /opt/bng-deploy/bin/rotate-controller-key.sh |
Immediately after first-run wizard |
| Metrics scrape token | sudo /opt/bng-deploy/bin/qt-scrape-token-rotate |
Quarterly, or after staff turnover |
| Per-operator API key | Delete + re-mint from API Keys page | Staff turnover; suspected leak |
| User password | sudo /opt/bng-deploy/bin/reset-user-password.sh <username> |
User forgot / suspected compromise |
Full recovery from complete key loss is documented in bootstrap-recovery.md.
Troubleshooting
Header shows VPP ? for > 10s
The controller can't talk to vpp-bridge. Usually a punt-socket or vpp-bridge health issue:
sudo systemctl status vpp vpp-bridge quantum-controller
sudo vppctl show errors | grep -i punt      # if "Socket TX" errors, vpp-bridge lost the socket
Restart in the right order (vpp first, then vpp-bridge, then controller):
sudo systemctl restart vpp
sleep 3
sudo systemctl restart vpp-bridge
sleep 2
sudo systemctl restart quantum-controller
DHCP DISCOVERs are being dropped
Controller journal will tell you why:
sudo journalctl -u quantum-controller --since '5 minutes ago' | grep onDiscoverCommon causes:
| Message | Cause | Fix |
|---|---|---|
captive required but no captive portal IP configured, dropping |
Gated AAA + no portal_ip set |
Portal Config → set portal_ip |
pool 'default' exhausted |
DHCP pool full | Pools & DNS → add capacity |
unknown line identity, unknown=reject |
Gated AAA, unlisted line, policy set to reject | Provision the line or flip unknown to captive |
session cap reached |
1,000-session free-tier cap | Activate a capacity licence — see Licensing |
Sessions header shows N but Sessions page table is empty
The header polls one endpoint; the page polls a different one. Usually a transient auth race just after login — hard-refresh the page (Cmd+Shift+R / Ctrl+Shift+R). If it persists across refreshes, check that the session cookie is still valid: User menu (top-right) → Profile → Session info.
CPESIM demo won't start — pool gateway 10.50.0.1/24 is already held by host-demo0p
The controller has a stale access_interfaces binding from a previous CPESIM run that didn't teardown cleanly. Reset:
sudo /usr/local/bin/reset-cpesimThis clears the stale record + restarts the whole CPESIM engine in the right order (vpp → vpp-bridge → controller → bng-demo).
AAA (LOCAL) DOWN — provider unreachable on the dashboard
The AAA local-provider file isn't readable. Usually a permissions issue after a manual API key mint:
sudo ls -la /var/lib/quantum-controller/api_keys.json
# should be owned by quantum-controller:quantum-controller, mode 0600
sudo chown quantum-controller:quantum-controller /var/lib/quantum-controller/api_keys.json
sudo systemctl restart quantum-controller
Long-running API calls (e.g., snapshot restore) return HTTP 500
Gunicorn's per-worker timeout killed the request. The installer drops in a 180s override at /etc/systemd/system/bng-deploy.service.d/10-timeout.conf — check it's still there. If you're doing something that takes longer than 180s (e.g., importing 5000 subscribers), bump the override:
sudo sed -i 's/--timeout 180/--timeout 300/' /etc/systemd/system/bng-deploy.service.d/10-timeout.conf
sudo systemctl daemon-reload
sudo systemctl restart bng-deploy
File locations + service commands
| Path | What lives there |
|---|---|
/opt/bng-deploy/ |
The webui shim (Flask app, venv, static assets, /bin/ scripts) |
/opt/bng-deploy/data/ |
User store, API keys, session store, settings, sqlite audit log |
/opt/bng-deploy/data/.controller_key |
The shim's own key for talking to the controller. Not for operator use. |
/opt/bng-deploy/data/.bootstrap_token |
The first-run setup wizard token (consumed on first use) |
/var/lib/quantum-controller/ |
Controller state: controller.db (SQLite), api_keys.json, audit.log, bng.json |
/opt/quantumtouch/data/prometheus/ |
Prometheus TSDB (14-day retention default) |
/opt/quantumtouch/etc/scrape-token |
The Prometheus scrape token |
/opt/bng-demo/ |
CPESIM plugin install root (only if installed via Toybox) |
/etc/vpp/startup.conf |
VPP dataplane config — cpu {} block controls worker pinning |
/etc/systemd/system/bng-deploy.service.d/10-timeout.conf |
Gunicorn --timeout override installed by the wrapper |
Service commands:
sudo systemctl status vpp vpp-bridge quantum-controller bng-deploy quantumtouch-prometheus
sudo systemctl restart bng-deploy               # webui restart, no dataplane impact
sudo journalctl -u quantum-controller -f        # tail controller log
sudo journalctl -u bng-deploy -f                # tail webui log
sudo vppctl show interface                      # VPP interface state
sudo vppctl show errors                         # VPP node error counters
sudo vppctl show threads                        # VPP worker mapping