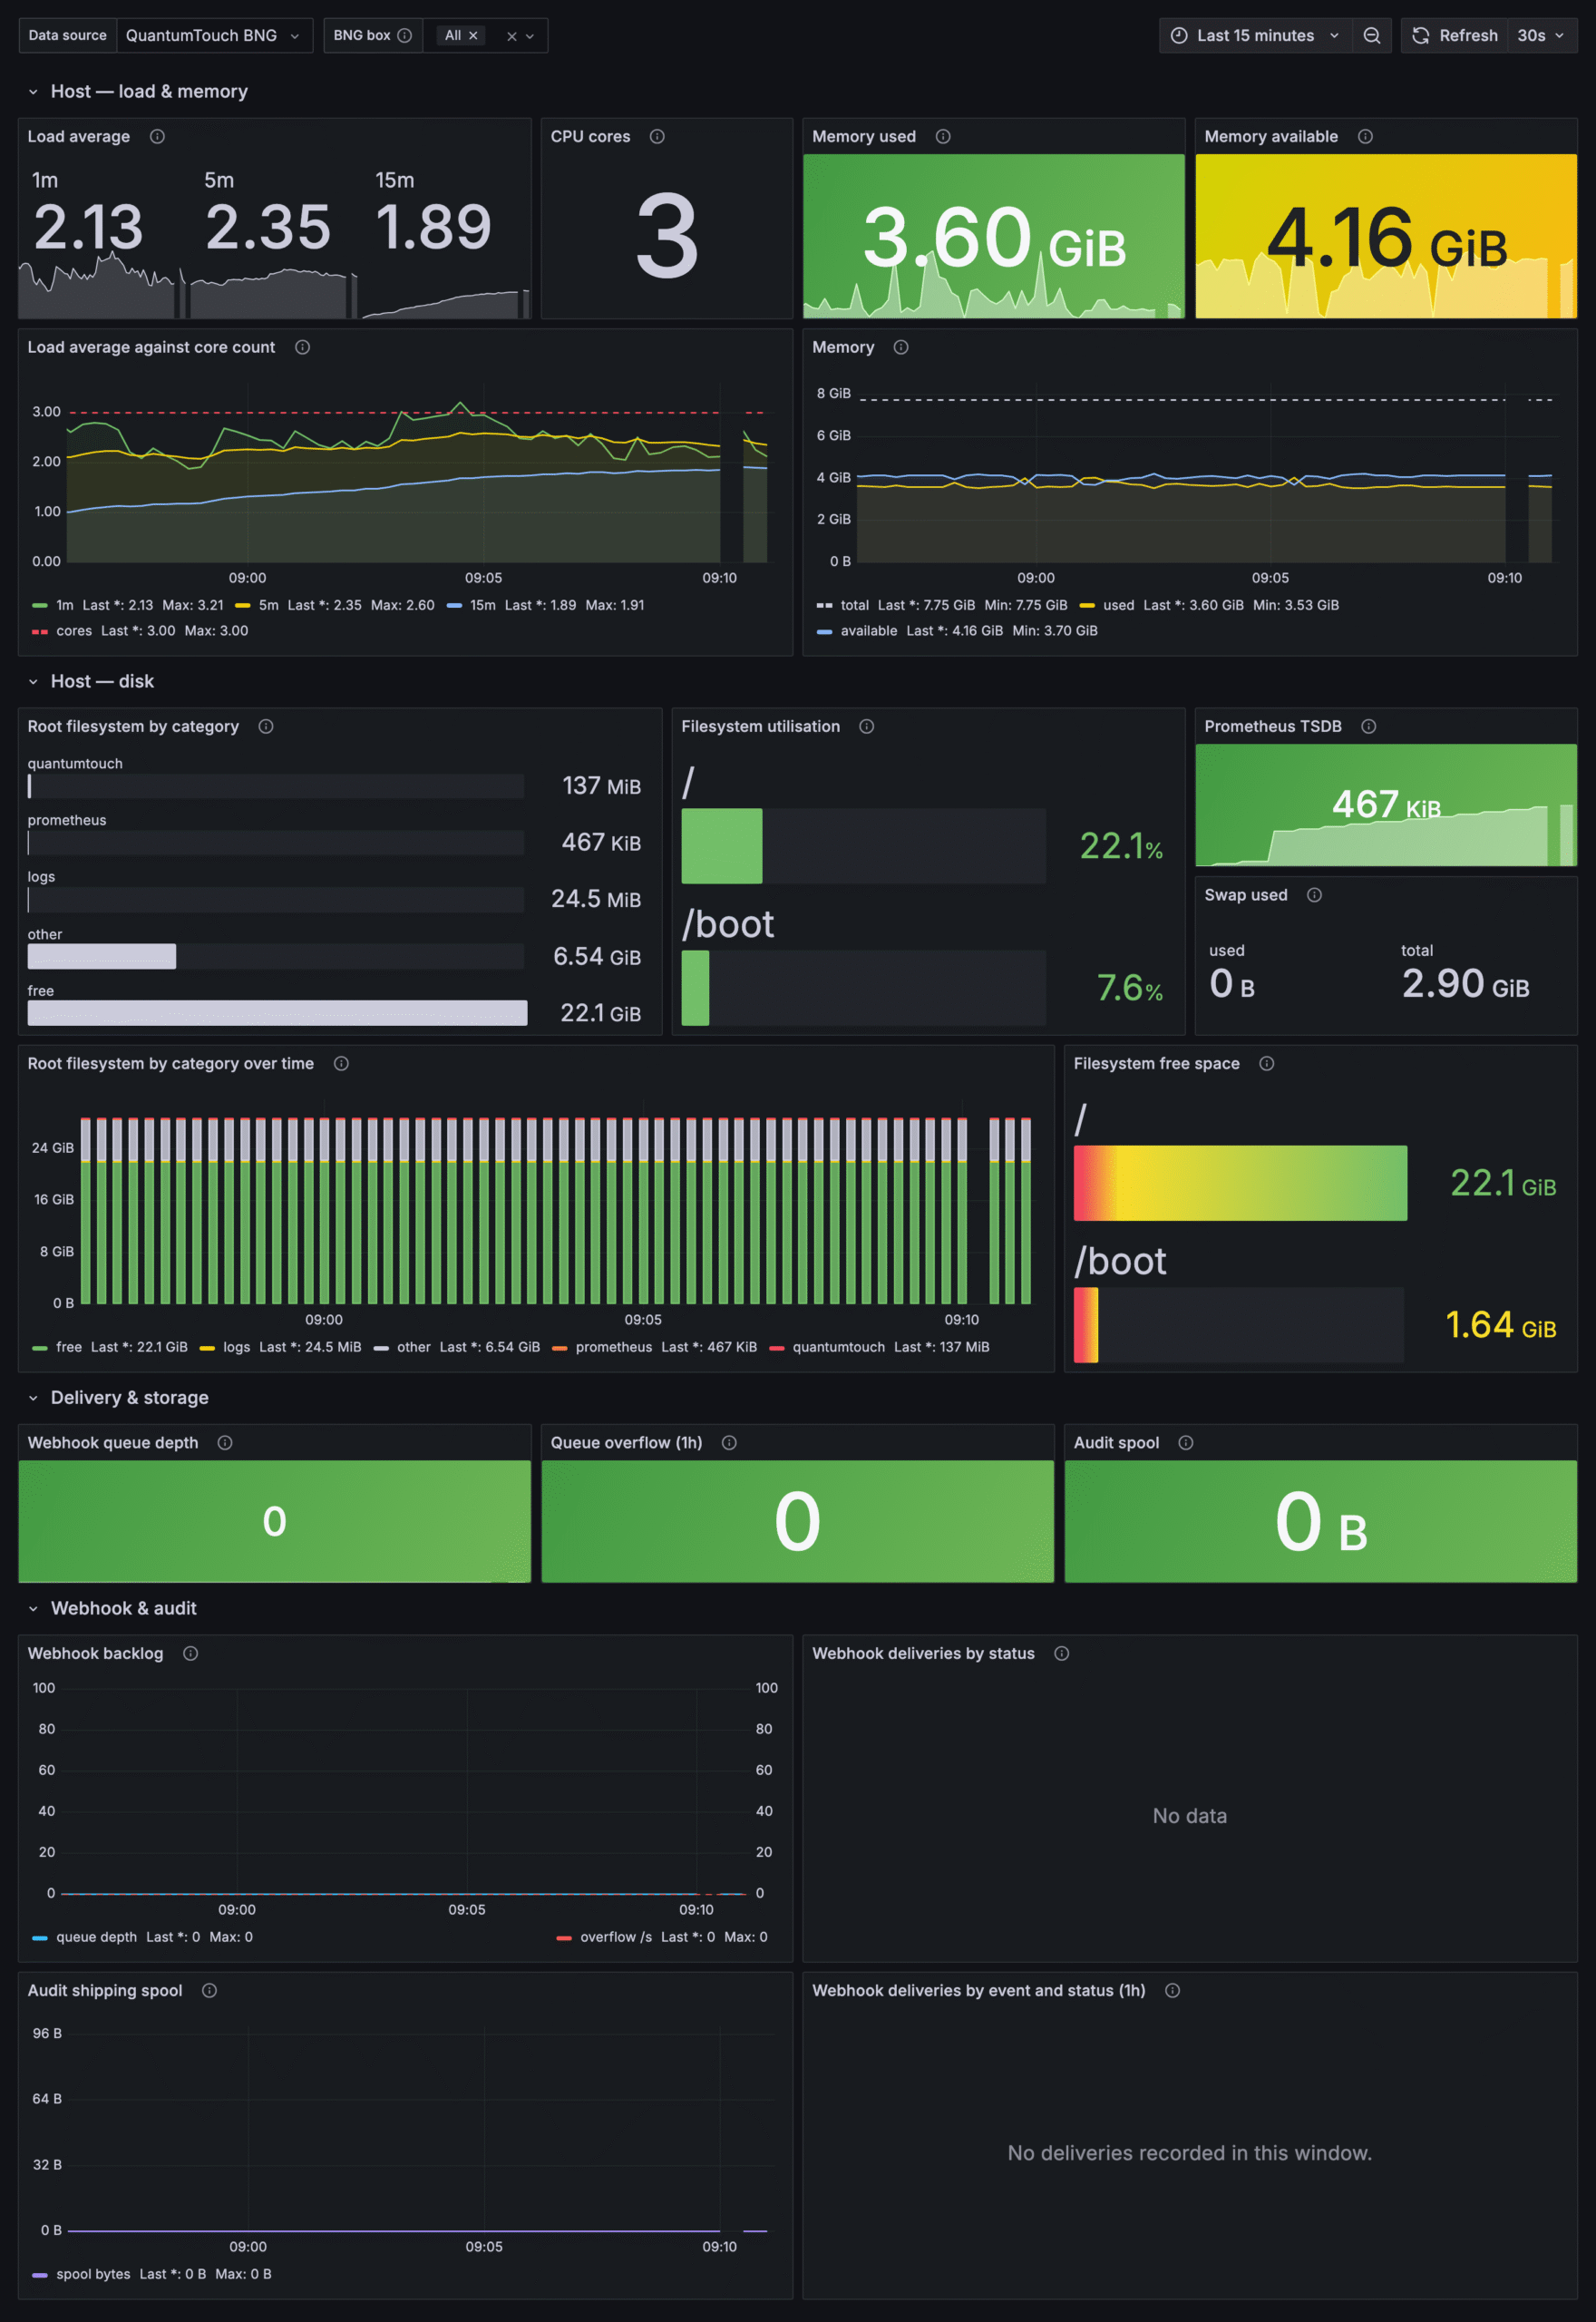
What you get
| Dashboard | Panels | What it answers |
|---|---|---|
| Overview | 14 | Are subscribers connecting, is traffic flowing, which QoS band is it landing in, is the reply path alive |
| Interfaces & Dataplane | 9 | Per-interface throughput and packet rates, VPP worker load |
| Access & Security | 18 | Who can log in, which API keys exist and when they expire, TLS certificate lifetime |
| Chassis & Power | 16 | IPMI sensors, thermal headroom, power feeds — physical hardware only |
| Platform Health | 19 | Webhook delivery queue, audit spool, metric baselines |
That is 76 panels across the five. Every dashboard is tagged quantumtouch
plus one area tag, so a single tag: quantumtouch filter in Grafana finds the
whole set.
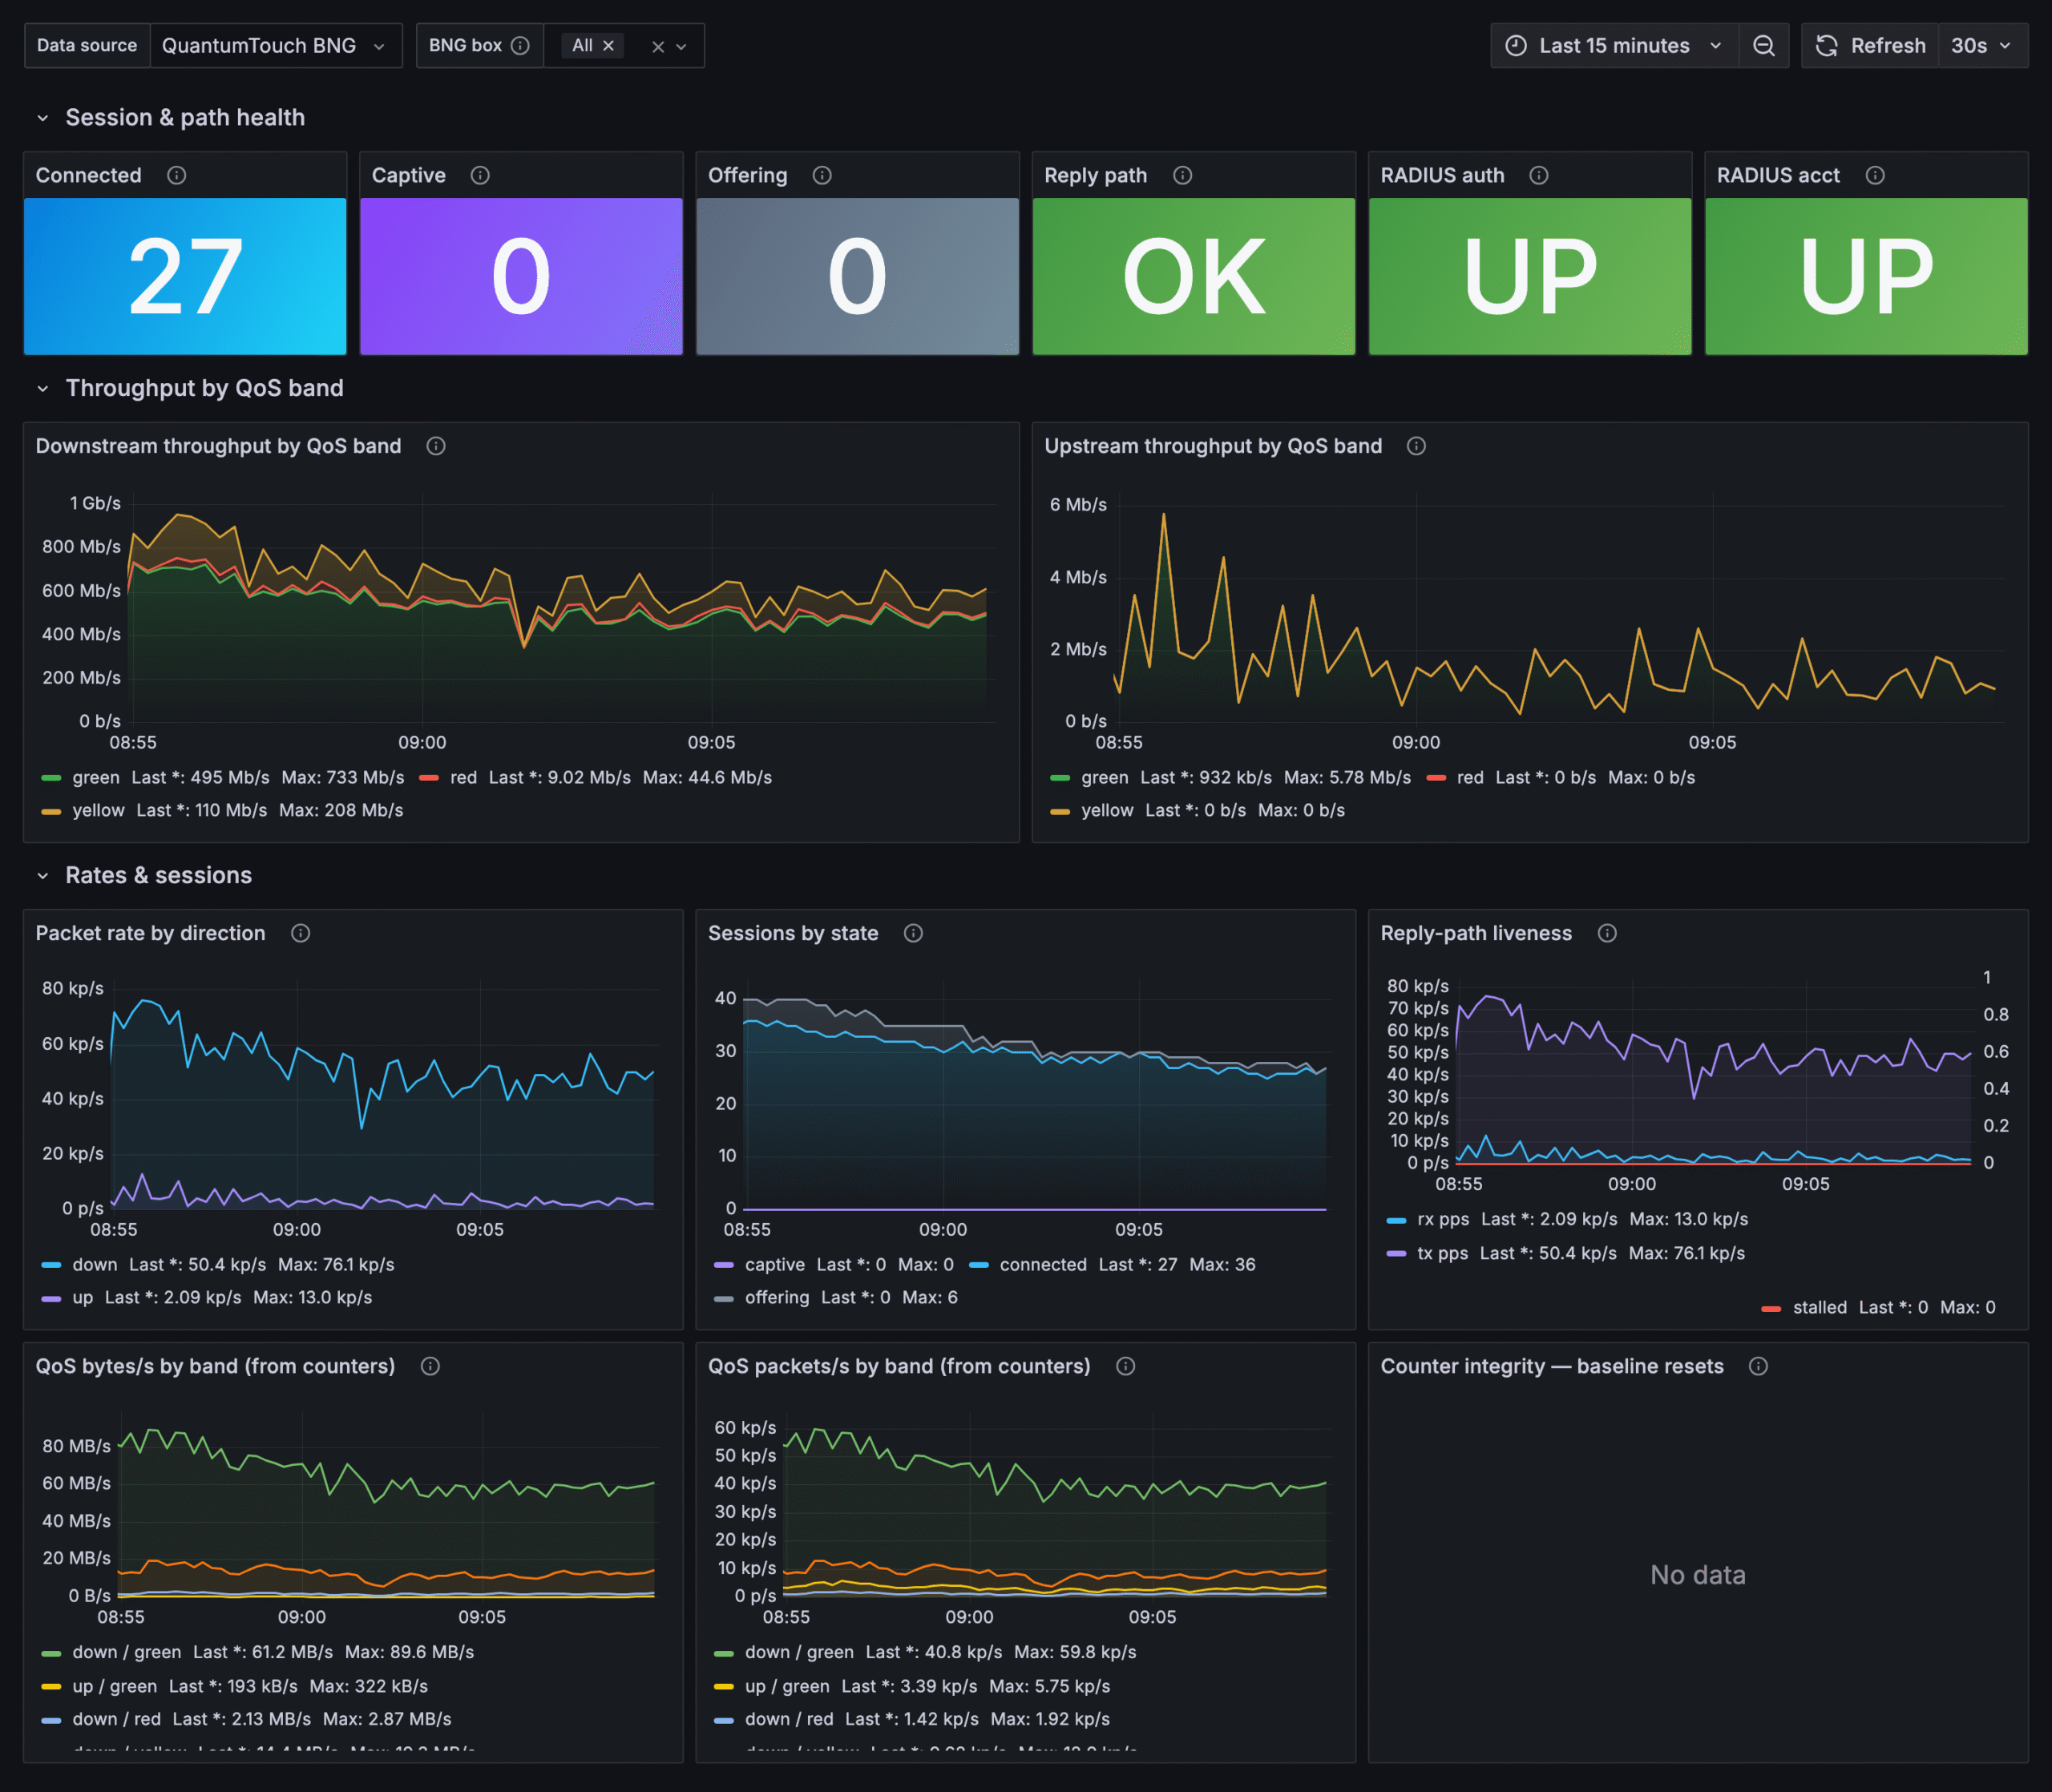
Overview, on an evaluation appliance running 30 simulated subscribers. The two
throughput panels are the tri-band QoS meter: green inside the committed rate,
yellow in the burst band, red over the ceiling.