
Step 2 — Create an API key for Grafana
Grafana authenticates to the BNG with an API key. Give the integration its own
key rather than reusing a person's.
Go to System → API Keys → Create key and choose the
"Grafana / metrics only" preset. It sets the role to read_only and
restricts the key to the metrics path, so it cannot be widened by mistake.
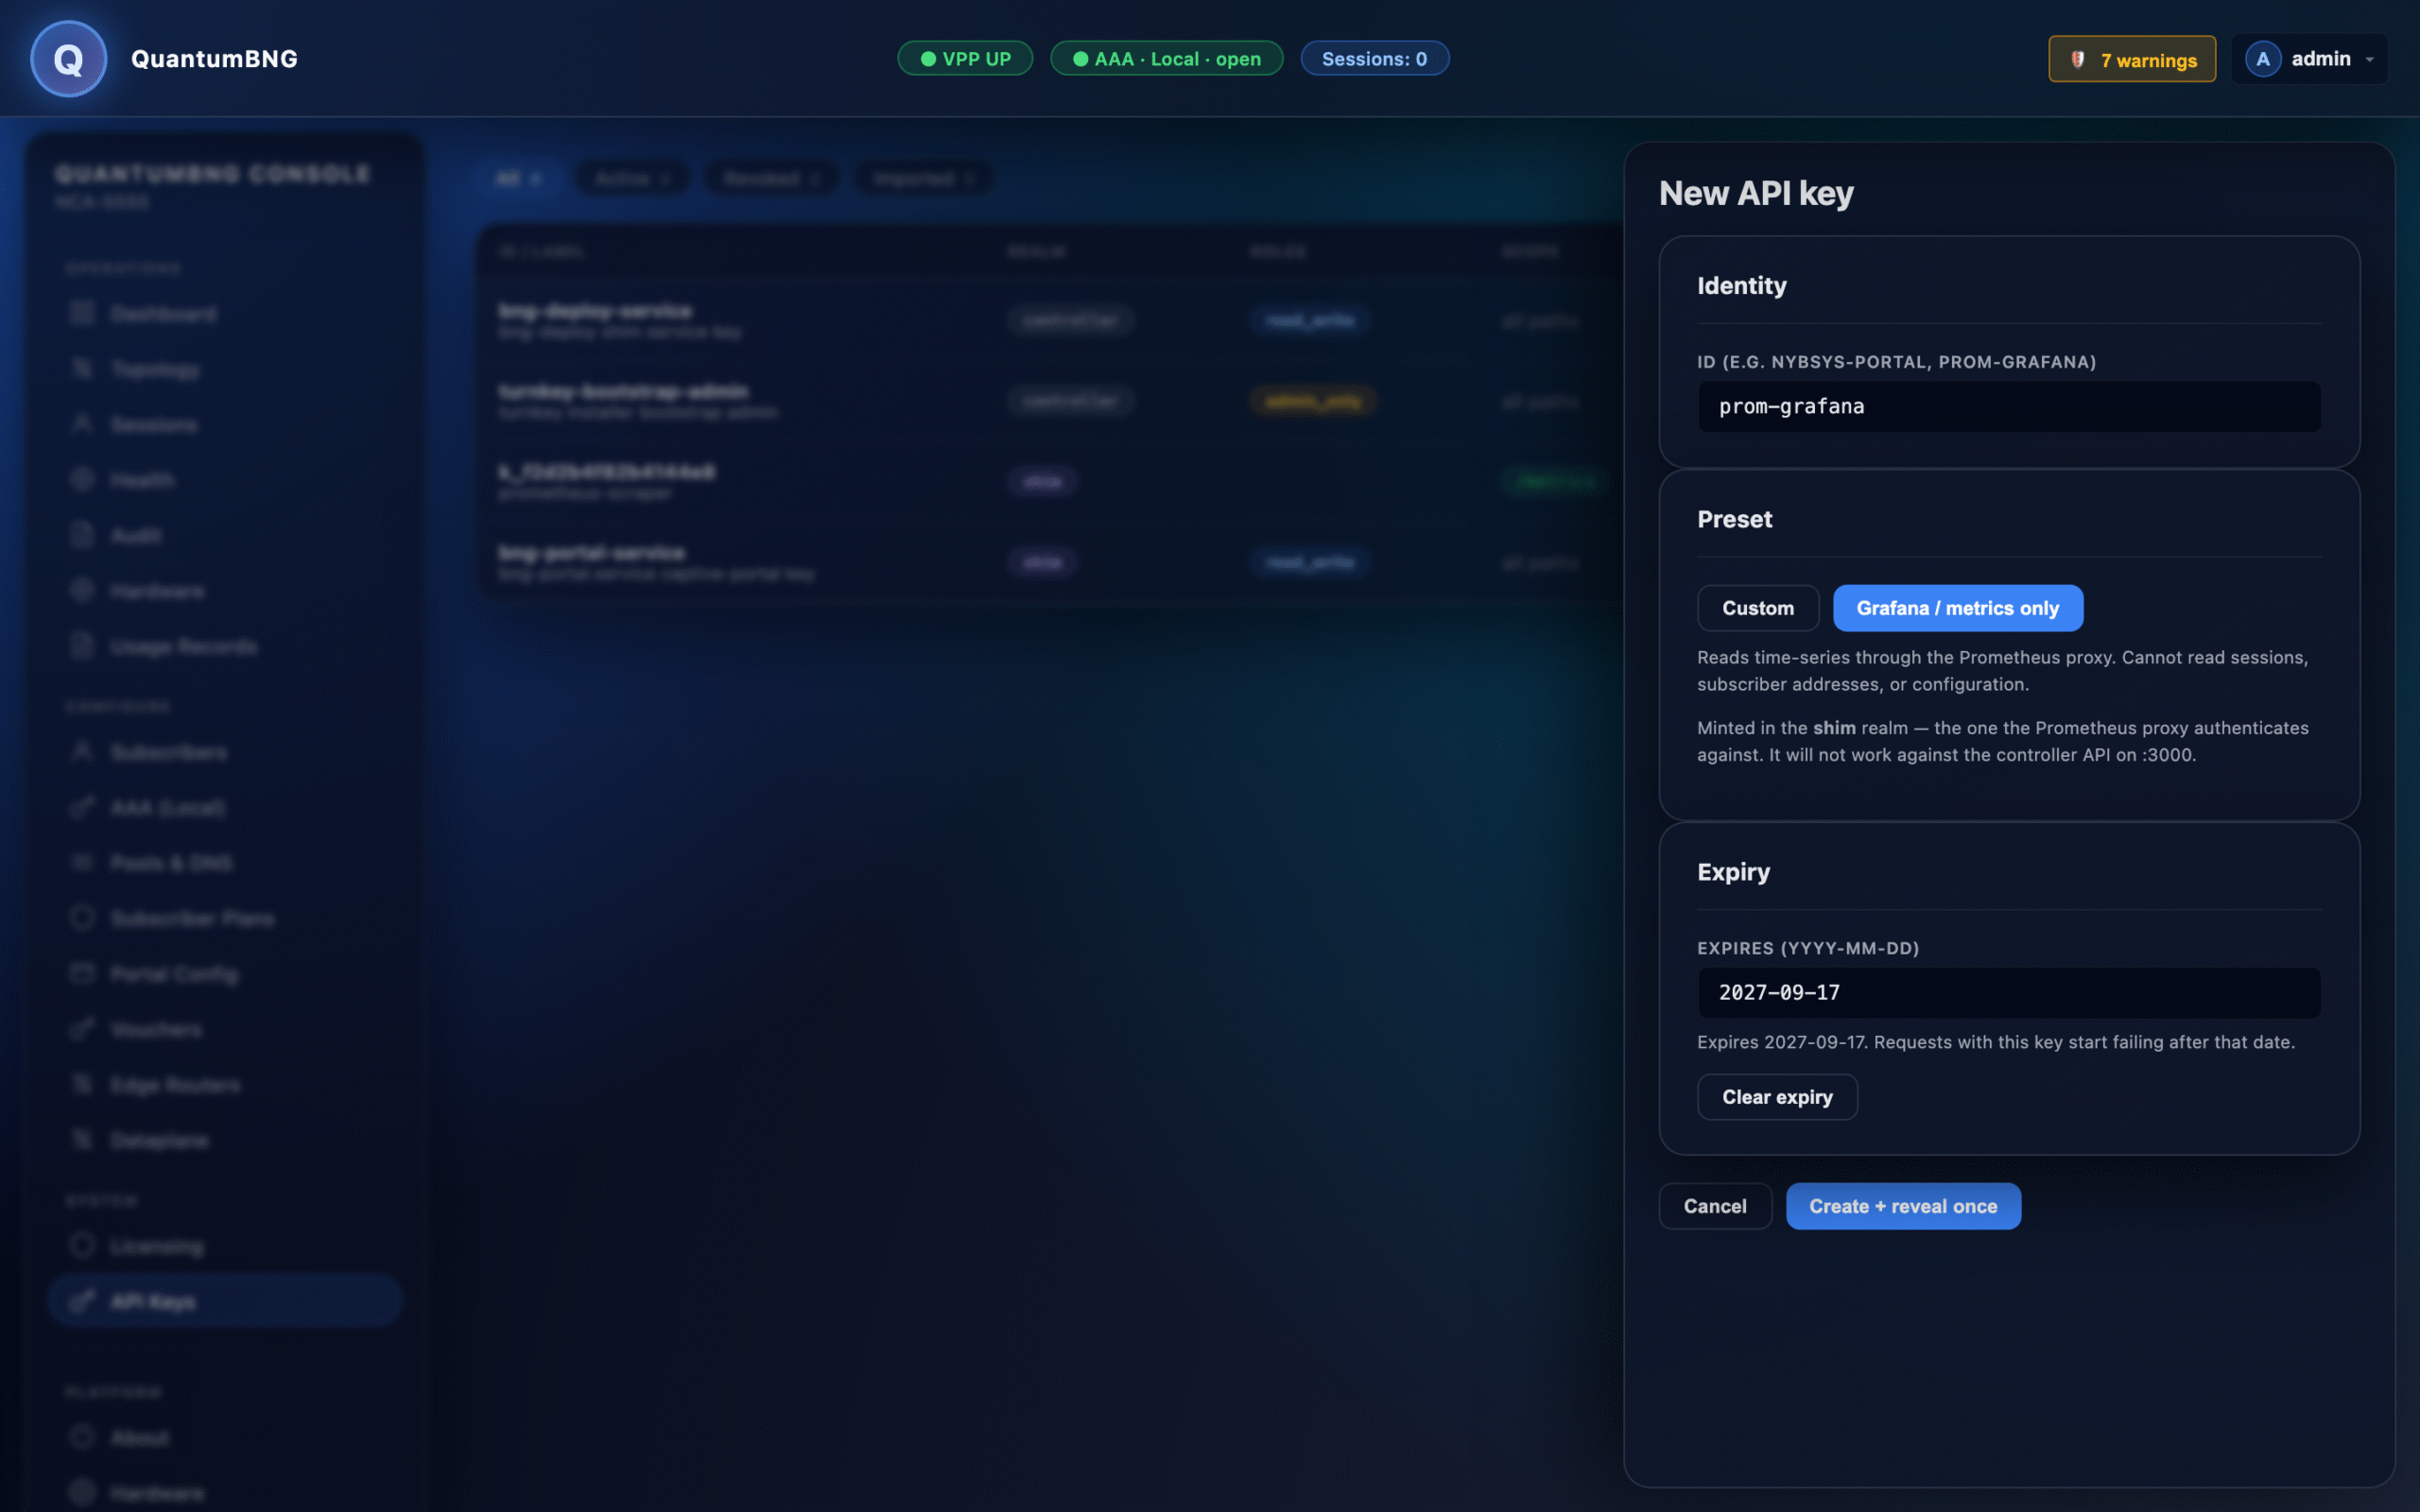
Click Create + reveal once and copy the token immediately. It is shown
exactly once — only its SHA-256 hash is stored, so a lost token cannot be
recovered, only replaced.
Set an expiry you will actually see coming. The preset defaults to 365
days. When an API key expires, every dashboard in this pack goes blank at the
same moment, and that presents as a broken BNG rather than an expired
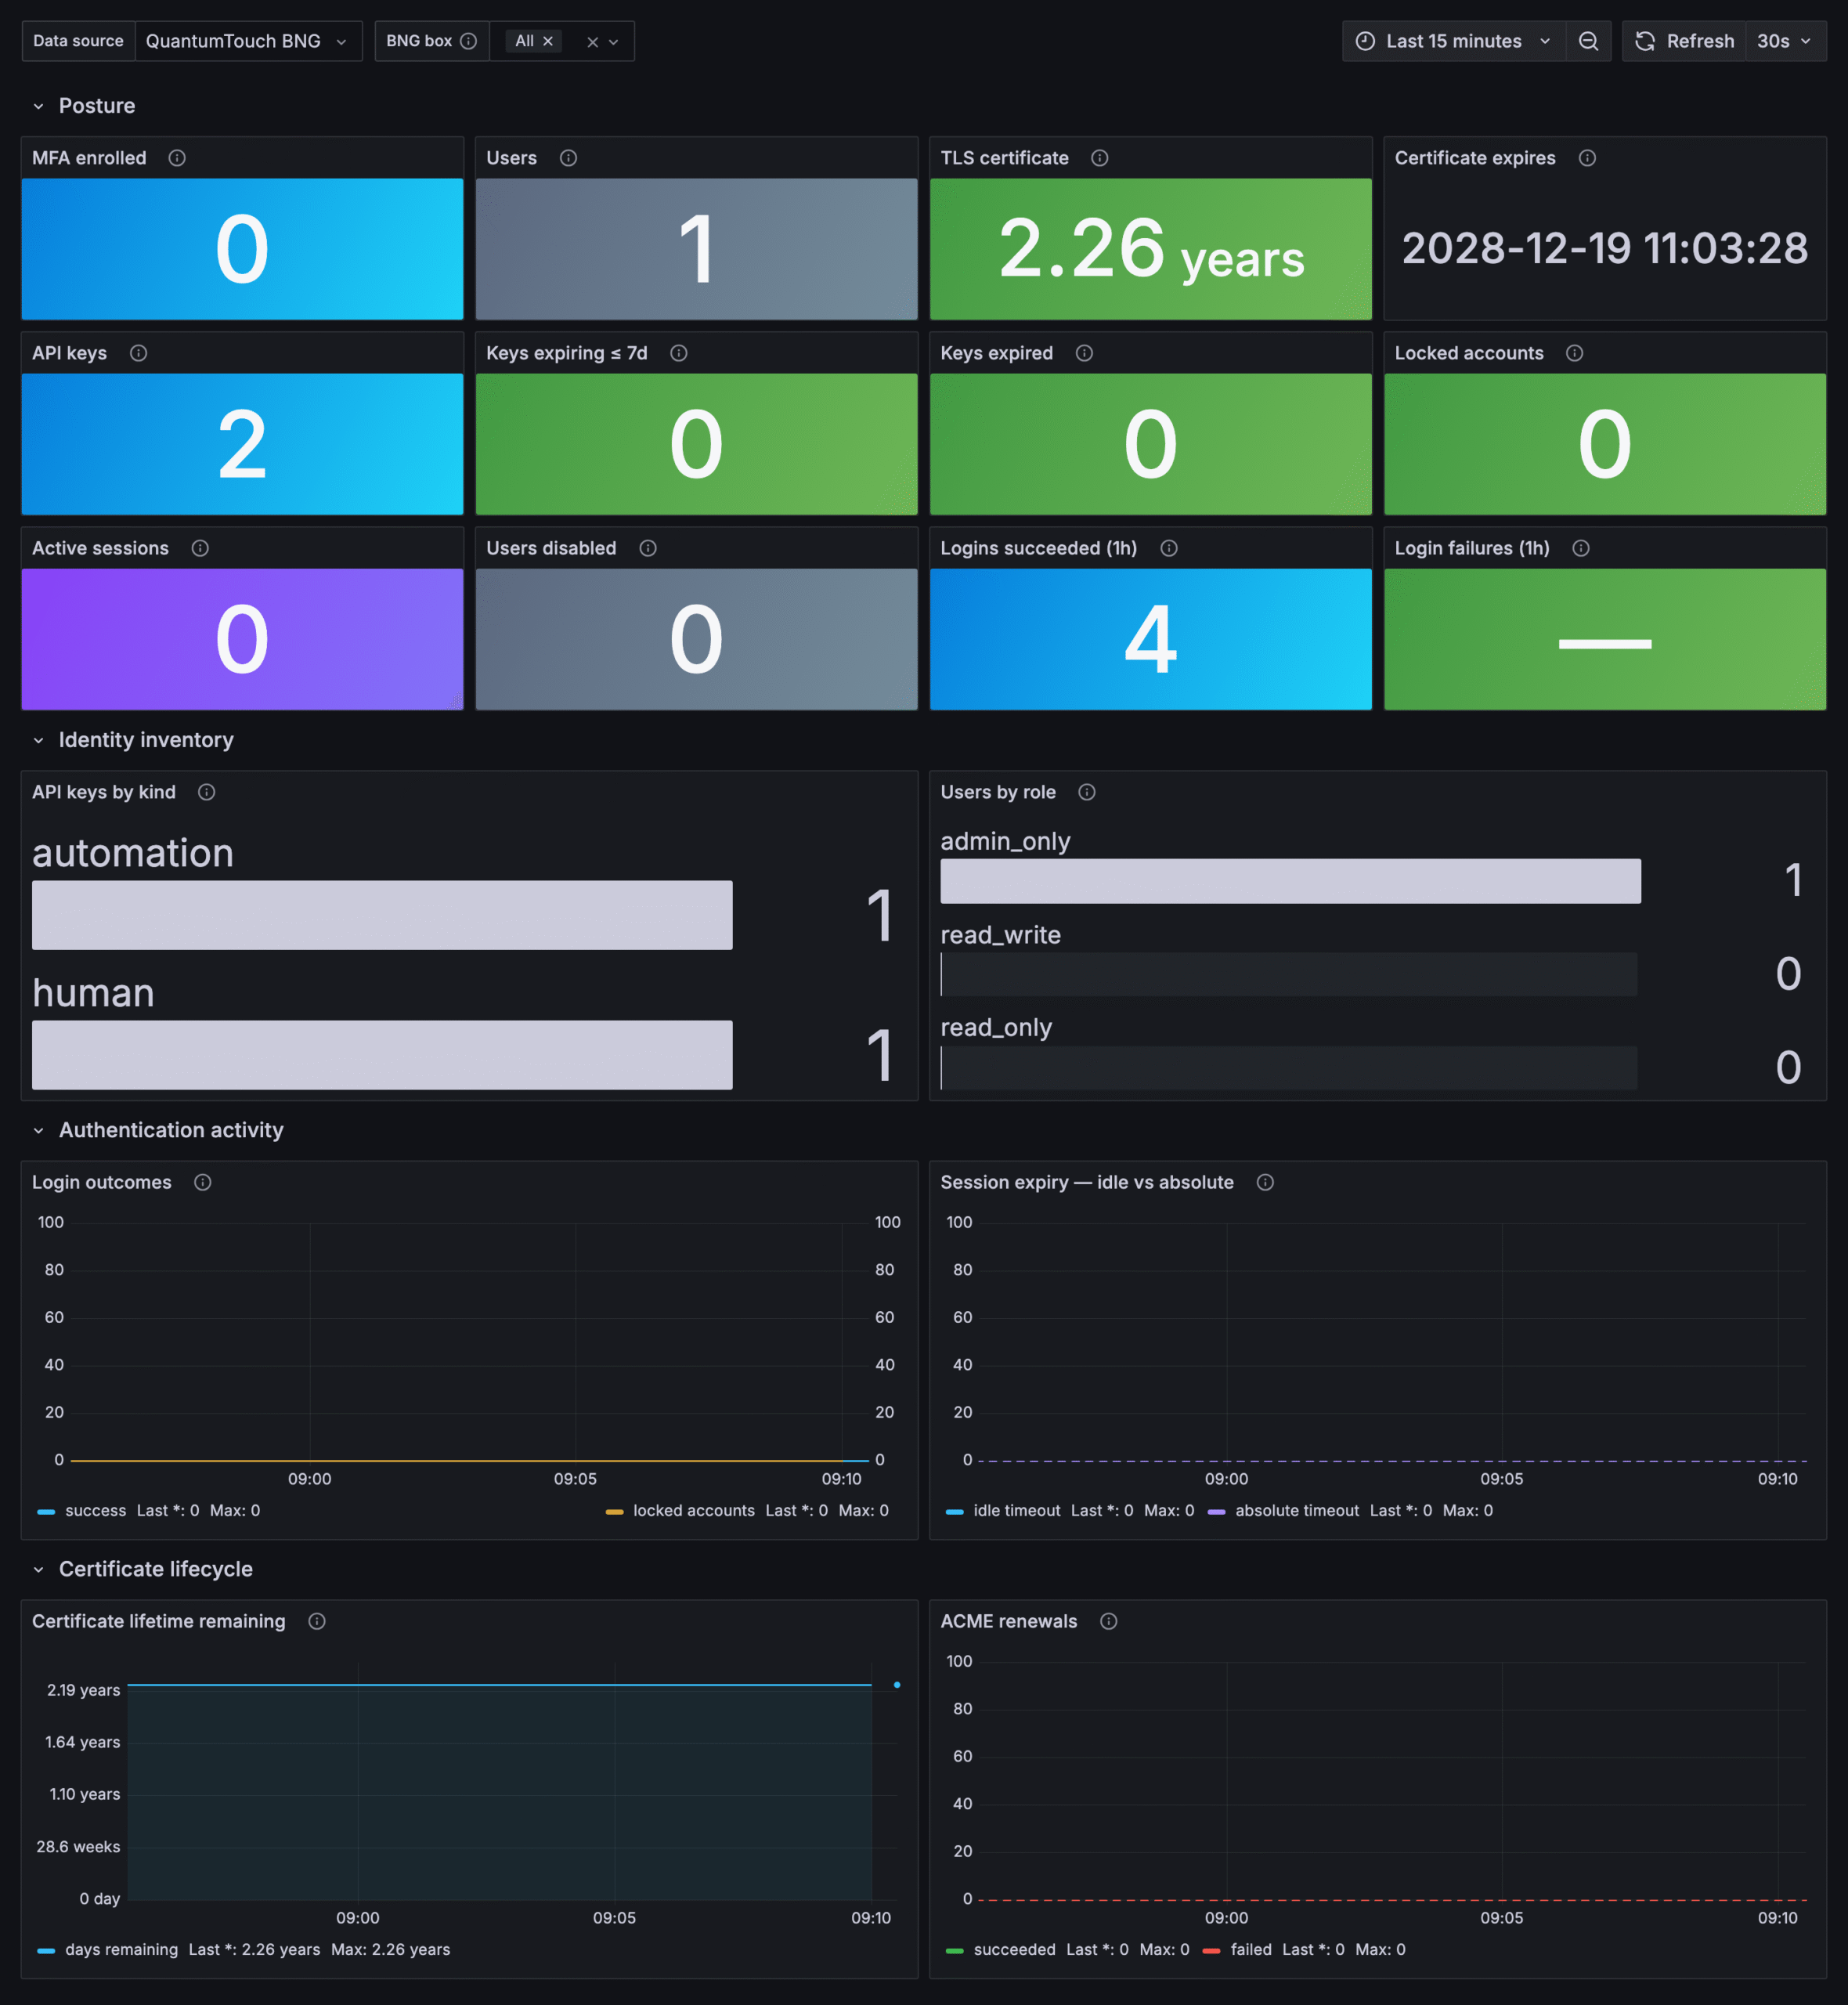
credential. The Access & Security dashboard carries a Keys expiring ≤ 7d
tile for exactly this — put it somewhere you look.
If you also want Grafana to pull the dashboards from the box
The "Grafana / metrics only" preset scopes the key to /api/bng/prometheus/*.
That is all the datasource needs, and if you import the dashboard files by hand
(Step 4) it is all you need at all.
The BNG also serves the staged dashboards over /api/bng/grafana/*, and a
preset-scoped key is refused with 403 on those routes — the role is right,
the path scope is not. If you want to fetch dashboards from the box, add
/api/bng/grafana/* to the key's path scope when you create it. Both routes
need only the read_only role.
| Route | Returns |
|---|---|
GET /api/bng/grafana/dashboards |
the staged dashboards, with uid, title and filename |
GET /api/bng/grafana/dashboards/<uid> |
one dashboard's JSON, byte-identical to what shipped |
GET /api/bng/grafana/pack.tar.gz |
the whole verified pack, as the original tarball |