
QuantumBNG 1.4.0 — Validation Report, 5,000 Subscribers
Release: QuantumTouch BNG 1.4.0, installer bundle 1.4.0-13
Run: 699, 2026-10-12, 188 minutes
Platform: 2-socket Intel Xeon E5-2640 v2 (2013 silicon), Ubuntu 24.04.4
Result: 4,663 checks passed, 1 failed, 4 skipped
1. Summary
A single 188-minute run of the full release suite against one physical BNG with
two 40GbE dataplane ports and two load-generator hosts, at a working set of
5,000 concurrent subscribers.
| Subscribers onboarded | 5,000 of 5,000 — 100% |
| Onboarding rate | 398.7 per second, 5,000 bound in 12.5 s |
| In-rush completion | 391.8/s cold, 405.5/s warm |
| Downstream throughput | 11.7 Gbps mean, 16.5 Gbps peak, 30.2 GB moved |
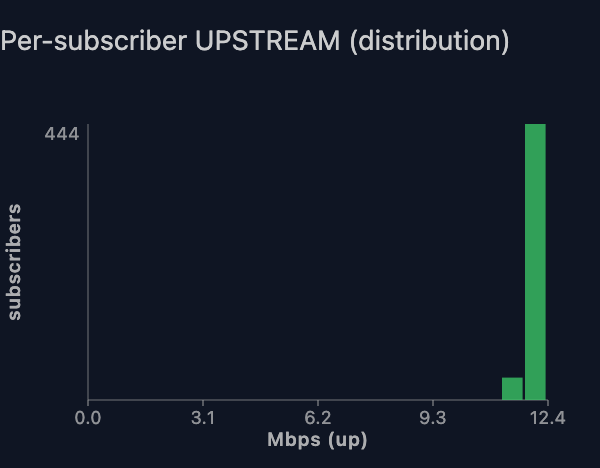
| QoS compliance | 480 of 480 measured subscribers within contract |
| Churn integrity | 1.0 — zero leaked sessions, zero orphans |
| Forwarding (2 workers, 64B) | 13.57 Mpps, platform-limited |
| Per-packet cost | ~330 cycles at 64B |
| Checks passed | 4,663 of 4,668 |
Read the hardware line before any throughput figure. These numbers come
from a processor that launched in 2013. They are floors, not best-case
results — see §3.1.
Four of the twenty forwarding cells are maximum-throughput numbers. A
further thirteen are wire-speed results — the box forwarded everything offered,
at 90% of link, with zero loss — and three are floors where the rig never filled
the link. Every cell is labelled with which it is. §5.7 explains how to read
them, and no floor is promoted into a product claim anywhere in this report.
2. How to read this report
Every performance measurement carries a limited_by field recording what ran
out first. Without it a reader cannot tell a product measurement from a
measurement of our test rig.
limited_by |
Means | Treat as a product figure? |
|---|---|---|
bng |
The platform was the constraint | Yes |
generator |
Our load generators ran out first | It depends — see below |
rss |
Receive-side distribution capped it | No — RSS is the limit |
none |
Neither side saturated | No — a latency or shape result |
controller |
The controller was the constraint | Yes, but name the component |
serial-by-design |
One operation in flight on purpose | No — latency, not throughput |
A generator label alone is not enough to judge a forwarding cell, because it
covers two different situations. If the generators had the link essentially full
and the box forwarded everything with zero loss, that is a wire-speed result
and a legitimate product figure. If the generators never filled the link, the
cell is a floor that understates the platform. The forwarding matrix in §5.7
separates these explicitly and this report never promotes a floor into a claim.
Two further conventions used throughout:
offered_headroom > 1means work arrived faster than the box drained it,
so the measured rate is the box's own. Below 1, the figure measures our
request rather than the platform.completion_rateis preferred overmean_rate. Mean rate divides by
wall clock including ramp, and understates the platform.
A skip is not a pass. Each of the four is named in §6.2 with its reason.
3. Test environment
3.1 Platform under test — hardware
| Server | 2-socket Intel Xeon E5-2640 v2 @ 2.00 GHz |
| Cores / threads | 16 cores (2 × 8), 1 thread per core — SMT disabled |
| Cache / NUMA | 40 MiB L3 (2 instances), 2 NUMA nodes |
| Memory | 31 GiB, with 8 × 1 GiB hugepages (all allocated to the dataplane) |
| Dataplane NICs | 2 × Intel XL710 40GbE backplane, [8086:1580] rev 01 |
| NIC driver | vfio-pci, both devices on NUMA node 0 |
| OS / kernel | Ubuntu 24.04.4 LTS, kernel 6.8.0-146-generic |
Full network controller inventory, read from dpdk-devbind --status on the
box under test. The XL710s are the only ports that carry subscriber traffic;
the rest are management and are listed so the inventory is complete:
| PCI | Controller chip | Interface | Driver | Role |
|---|---|---|---|---|
0000:01:00.0 |
Intel XL710 40GbE backplane [8086:1580] |
FortyGigabitEthernet1/0/0 |
vfio-pci |
Access — subscriber side |
0000:47:00.0 |
Intel XL710 40GbE backplane [8086:1580] |
FortyGigabitEthernet47/0/0 |
vfio-pci |
Uplink — core side |
0000:04:00.1 |
Intel DH8900CC Gigabit backplane [8086:043c] |
enp4s0f1 |
igb |
Management / harness SSH (the only active 1G port) |
0000:04:00.2-4 |
Intel DH8900CC Gigabit backplane [8086:043c] |
enp4s0f2-4 |
igb |
Unused |
0000:4a:00.0 |
Intel I350 Gigabit [8086:1521] |
enp74s0f0 |
igb |
Unused on this box |
0000:4a:00.1 |
Intel I350 Gigabit [8086:1521] |
enp74s0f1 |
igb |
Unused |
0000:04:00.0 |
Intel DH89XXCC QAT [8086:0434] |
— | — | Crypto accelerator, unused |
Both XL710 ports are backplane variants — this is a blade chassis, not a
box with pluggable optics. Neither the QAT accelerator nor any offload beyond
RSS is used on the forwarding path; no-tx-checksum-offload is set in §3.3, so
the per-packet cost in §5.7 is software forwarding cost.
What this hardware means for the numbers
The processor launched in 2013. The E5-2640 v2 is a 2.0 GHz Ivy Bridge-EP
part — two generations before DDR4, and roughly a decade behind anything a
customer would deploy new today. We state the platform prominently because it is
the most important context for every forwarding figure here: these are floors
measured on old silicon. A reader deploying current hardware can reason
upward from them.
Symmetric multithreading is disabled (1 thread per core), so each dataplane
worker is a physical core with no sibling contention — and equally no benefit
from SMT.
Core isolation is applied. The boot command line is:
default_hugepagesz=1G hugepagesz=1G hugepages=8 irqaffinity=0-1
isolcpus=2-6 nohz_full=2-6 rcu_nocbs=2-6
intel_pstate=disable processor.max_cstate=1 intel_idle.max_cstate=0 idle=poll
numa_balancing=disable hpet=disable mce=off tsc=reliable nmi_watchdog=0
intel_iommu=on iommu=pt
The kernel confirms it: /sys/devices/system/cpu/isolated reads 2-6, and all
five VPP workers sit on exactly that set with interrupts confined to cores 0–1.
An honest note on what isolation bought. We measured this platform both
without and with core isolation. It produced no throughput improvement. The
two isolated runs reproduce each other to within 0.2% on the single-worker
cells, and both sit 2.5–3.9% below the single un-isolated run; the two-worker
cells agree within 1.1% across all three. We are not claiming isolation harms
forwarding — the un-isolated condition was measured once, and nohz_full /
rcu_nocbs carry their own overheads we did not isolate. The honest conclusion
is that on a box where nothing else contends for the worker cores, isolation
removes contention that was not there. It remains correct practice because it
protects against future contention, not because it raised these figures.
NUMA locality is correct. The dataplane uses main-core 1 with
corelist-workers 2-6, and CPUs 0–6 all sit on NUMA node 0 — the same node as
both NICs. No cross-socket traffic on the forwarding path.
3.2 Platform under test — software
| Installer bundle | quantumtouch-installer-1.4.0-13 |
| BNG plugin | 0.10.36, commit 9a12835, clean tree |
| Controller | quantum-bng-controller:1.4.0 (container) |
| quantum_core | v1.6.0 |
| VPP | v25.10.0-23~g744d3c715 |
| CPESIM | 0.4.17 |
| Metrics | Prometheus (container) |
3.3 Dataplane configuration
Taken verbatim from the running /etc/vpp/startup.conf:
cpu     { main-core 1   corelist-workers 2-6 }
memory  { main-heap-size 2G }
buffers { buffers-per-numa 1048576   default data-size 2048 }
statseg { size 1024M }
dpdk    { uio-driver vfio-pci   no-multi-seg   no-tx-checksum-offload
          dev 0000:01:00.0 { num-rx-queues 5  num-tx-queues 6
                             num-rx-desc 4096 num-tx-desc 4096
                             rss { ipv4 ipv4-udp ipv4-tcp } }
          dev 0000:47:00.0 { ... same ... } }
Receive-queue placement — one queue per worker, both interfaces, no sharing:
| Worker | lcore | Access queue | Uplink queue |
|---|---|---|---|
vpp_wk_0 |
2 | 0 | 0 |
vpp_wk_1 |
3 | 1 | 1 |
vpp_wk_2 |
4 | 2 | 2 |
vpp_wk_3 |
5 | 3 | 3 |
vpp_wk_4 |
6 | 4 | 4 |
The statistics segment is sized to 1024 MB. VPP's 32 MB default is exhausted
well before this scale, because the BNG allocates a forwarding entry and
per-session counters for every subscriber.
3.4 Service configuration
| Subscriber pool | 100.64.0.0/17 (32,766 usable) |
| Access interface | FortyGigabitEthernet1/0/0 |
| Uplink interface | FortyGigabitEthernet47/0/0 |
| AAA mode | open admission (local AAA measured separately in §5.8) |
| Captive portal | 100.64.0.1 |
| Plan under test | Bronze — 20/25 Mbps down (CIR/PIR), 10/12 Mbps up |
| DHCP relay | giaddr block of 64, 100.64.127.1 upward |
3.5 Licence state, verified at launch
The session cap is a property of the licence, not the platform, so the gate
records it before the run starts:
licence VALID        grant bng.max_sessions = 25000
cap 25000            0 sessions resident
A reader may notice the platform reports max_source: free_baseline even when
fully licensed. The number is correct; that provenance label is wrong
upstream and is being tracked. The cap in force during this run was 25,000,
and the working set was 5,000 — so no result here is cap-constrained.
3.6 Load generation
| Generators | 2 hosts (bluedot2, bluedot3) |
| Simulator | CPESIM 0.4.17 |
Both generator hosts are wired symmetrically with a port on each side of the
BNG, and each carries two roles:
| Host | Role | Interface | PCI bus | Address |
|---|---|---|---|---|
bluedot2 |
CPE generator (access side) | enp1s0f0 |
01:00.0 |
L2 only, no address |
bluedot2 |
Uplink origin (core side) | enp71s0f0 |
47:00.0 |
10.0.0.3/24 |
bluedot3 |
CPE generator (access side) | enp1s0f0 |
01:00.0 |
L2 only, no address |
bluedot3 |
Uplink origin (core side) | enp71s0f0 |
47:00.0 |
10.0.0.2/24 |
Both origins hold a return route 100.64.0.0/17 via 10.0.0.1 so downstream
traffic reaches the subscriber pool. This run used both hosts for CPE
generation, with bluedot3 as the active uplink origin (10.0.0.2).
The access-side interfaces carry no IP address: the simulator drives raw frames
on them, relaying DHCP with a source giaddr, so there is nothing for the host
kernel to address. The PCI buses above are derived from the predictable
interface names (enp71s0f0 → bus 0x47) and place the generator ports in the
same slots as the platform's own, these being identically-specified chassis.
On the generator NIC chips. The generators were not read with
dpdk-devbind during this run, so their controllers are not confirmed
first-hand here. The evidence that they match the platform is strong but
indirect: all three chassis enumerate the same PCI topology — a 40GbE port at
bus 01:00.0, a second at 0x47, and an Intel I350 pair at bus 0x4a (idle on
the box under test, and the management port on bluedot3). Identical
slot-for-slot enumeration across three machines indicates identically-specified
chassis,
which would put Intel XL710 backplane controllers in the generators too.
Treated as inference, not measurement, and flagged for first-hand confirmation
on the next rig session.
It does not weaken the report, because generator capability here is established
by measurement rather than part number: the ceilings in §5.7 are ~20 Gbps
aggregate, 15.2 Mpps at 128B and 21.93 Mpps at 64B, each held byte-identical
across five different platform configurations. A part number would explain those
ceilings; it would not change them, and it is the measured ceiling that makes
the generator-limited cells floors.
The generators bound most forwarding cells, but not all in the same way.
Of the 20 UDP cells, 4 found a platform ceiling, 13 reached line rate with zero
loss, and 3 are floors where the rig under-offered. The distinction matters:
only the floors understate the platform. §5.7 separates them, and the rig's
~20 Gbps aggregate ceiling is what makes the large-frame cells wire-speed
results rather than shortfalls.
4. Method
4.1 Suite composition
Twelve suites, 4,668 checks: framework authentication, console dashboard,
security, capacity and cap enforcement, licence API, console UI behaviour, gated
local-AAA admission, simulated CPE (onboarding, traffic, QoS, churn), DORA
in-rush, dataplane, forwarding performance, and unauthenticated admission.
4.2 Pre-flight gate
The run does not start until twelve conditions hold. This is quoted verbatim
from the launch output because reproducibility depends on it:
===== 1/3 licence unit =====
  License state: VALID  (valid: true, 36500 days remaining)
===== 2/3 drain sessions to zero =====
  start: 0        final: 0
===== 3/3 launch gate =====
  OK   licence VALID          OK   grant 25000
  OK   cap 25000              OK   0 sessions
  OK   vpp connected          OK   status ok
  OK   aaa open               OK   Bronze shaped
  OK   pool /17               OK   captive portal set
  OK   access iface           OK   uplink iface
GATE: PASS
  BUNDLE_VERSION=1.4.0-13
  sha=9a12835 dirty=False
Two of these deserve explanation. Sessions are drained to zero explicitly
because a reboot does not clear them — the controller persists sessions and
restores them with their original timestamps, so a previous run's fleet would
silently become this run's starting condition. And the Bronze plan's rates are
verified because a cancelled run can leave the plan unshaped, which would make
every QoS result in §5.6 meaningless while still looking plausible.
4.3 Parameters
| Subscribers | 5,000 |
| Requested onboarding rate | 200/s (900/s for the in-rush phases) |
| Success threshold | 0.95 |
| Churn duration | 300 s |
| Churn fraction | 0.5 |
| Traffic direction | bidirectional |
4.4 Reproducibility
The platform ran bundle 1.4.0-13 from commit 9a12835 with a clean working
tree. Run 699 used identical parameters to runs 696 and 698 on the same
hardware, which is what makes the three-run comparison in §3.1 meaningful.
5. Results
5.1 Subscriber onboarding — run-699-cpe.json
What it measures. Every simulated CPE performs a real DHCP DORA exchange
through the relay. The check is how many reach a bound session, and how fast.
Why it matters. This is the operation an ISP performs most: a subscriber
powering on. A platform that onboards slowly recovers slowly from an outage.
| Target / bound | 5,000 / 5,000 |
| Success rate | 100% |
| Rate | 398.7 bound per second |
| Elapsed | 12.54 s |
| DORA latency p50 | 1,389 ms |
| DORA latency p95 | 9,279 ms |
| Minimum / maximum | 211.7 ms / 10,514 ms |
| Retransmits | 1,469 |
Read the latency figures as queueing delay, not service time. The whole
fleet is launched at once, so a subscriber's measured DORA time includes waiting
behind the rest of the storm. The p50 of 1.4 s does not mean a single
subscriber waits 1.4 s on an idle box — the minimum of 211 ms is closer to that.
The 1,469 retransmits are the DHCP protocol doing its job under a burst; no
subscriber was lost.
5.2 In-rush, cold versus warm — run-699-dora-inrush.json
What it measures. A 900/s requested storm against a cold box, then the same
storm again once caches and sessions are warm.
Why it matters. It separates steady-state capability from first-contact
behaviour — the difference between a planned migration and a recovery.
| Phase | Completion rate | limited_by |
|---|---|---|
| Cold | 391.8/s | none |
| Warm | 405.5/s | none |
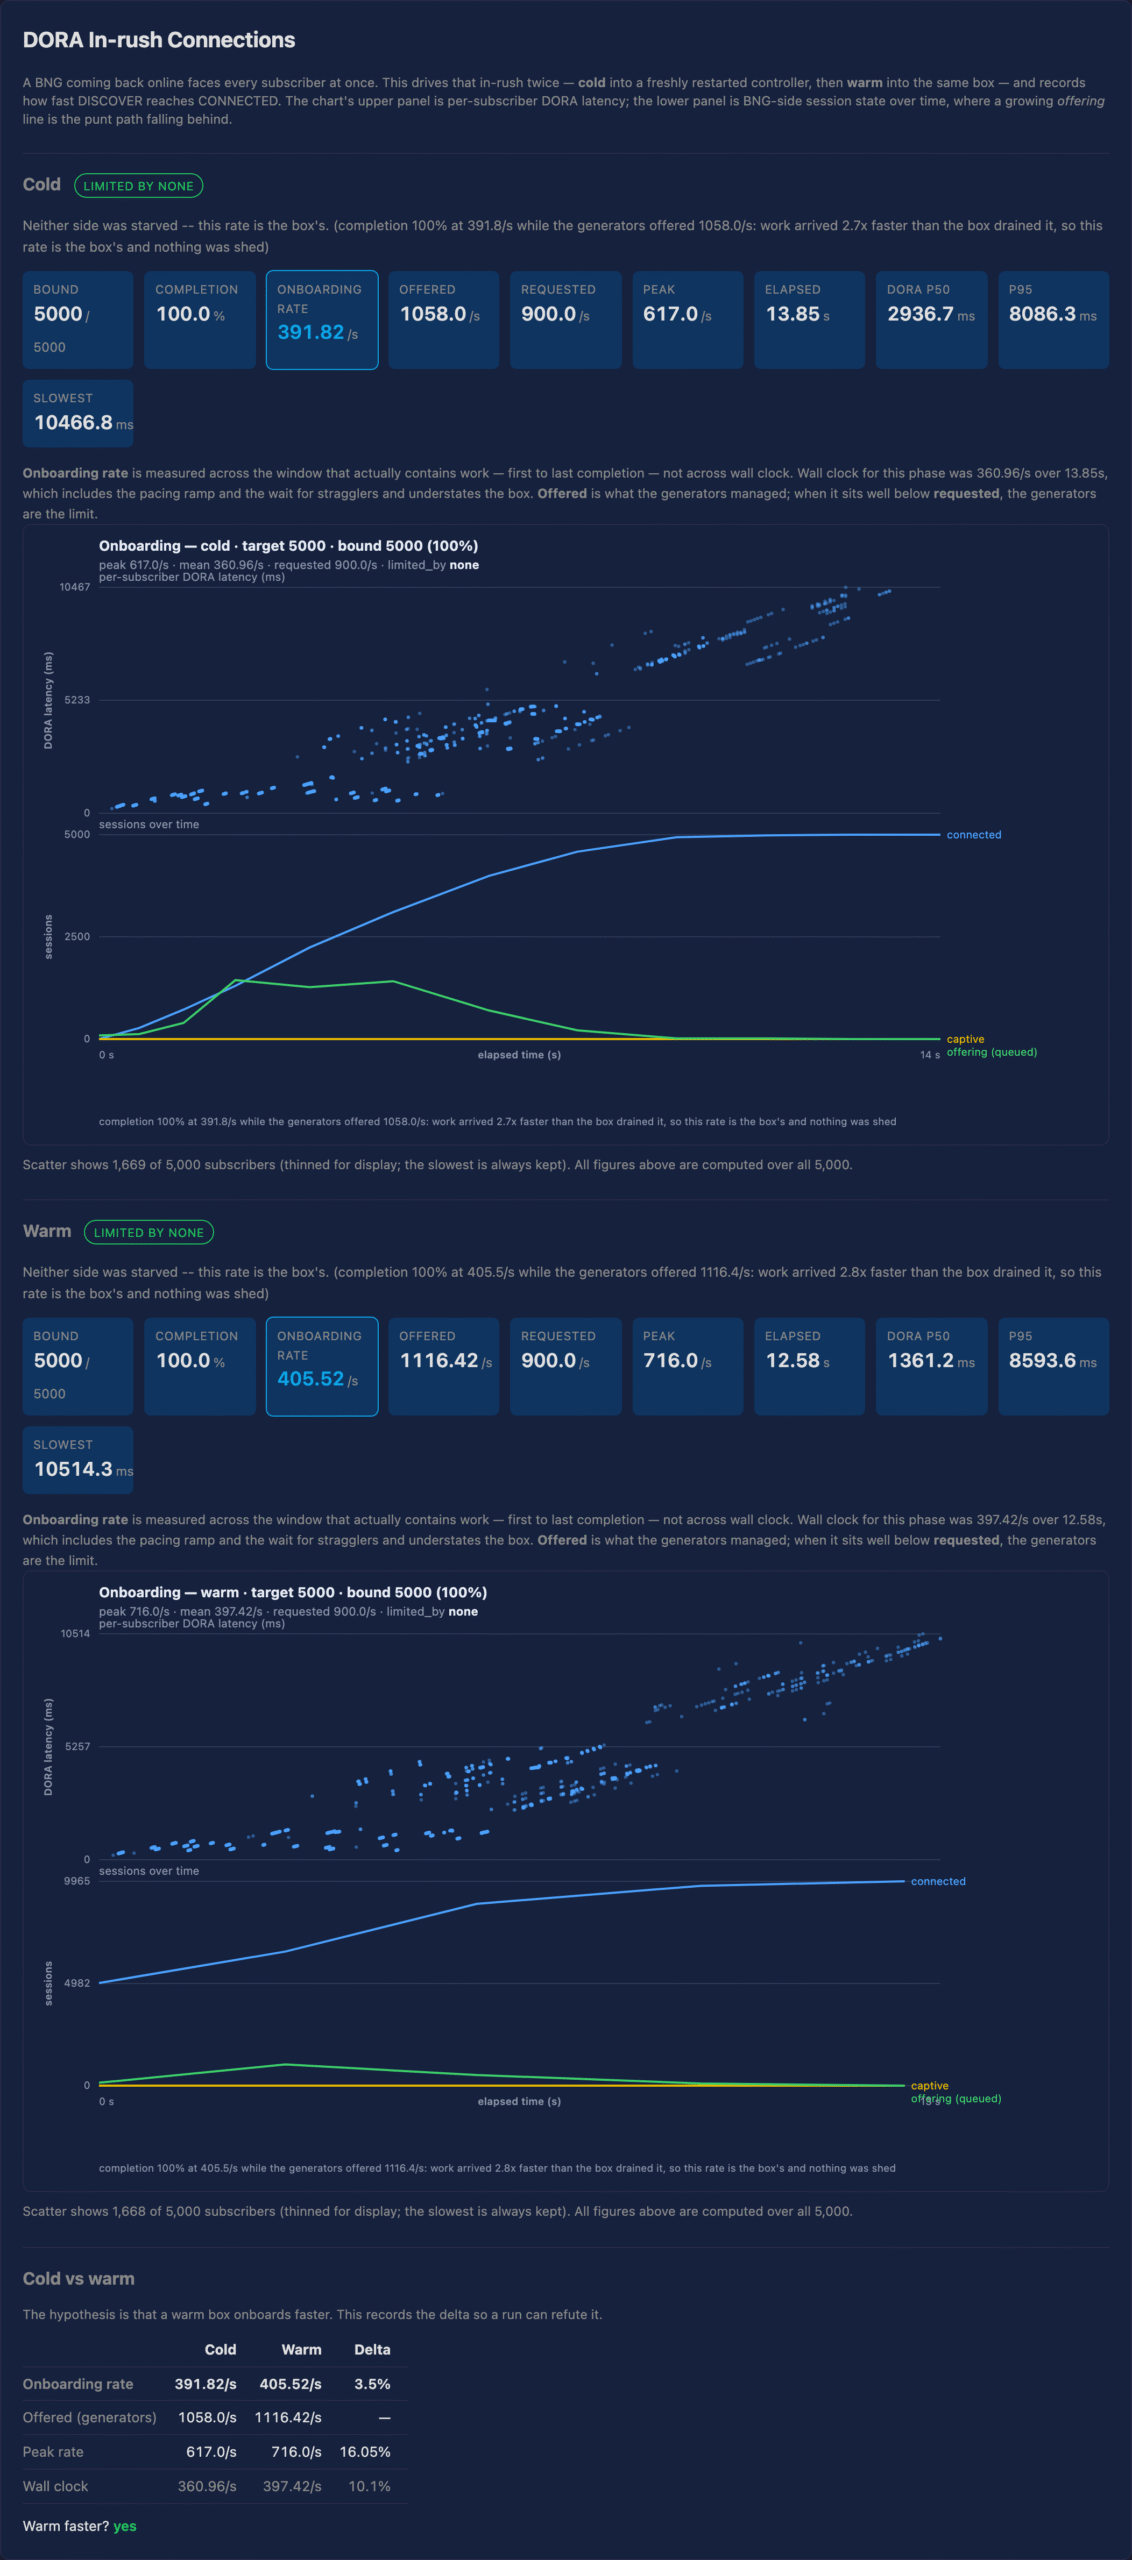
limited_by: none means neither the platform nor the generators saturated at
this offered level, so these are shape results rather than a ceiling. The warm
phase being ~3.5% faster than cold is the expected direction and small.
5.3 Capacity and cap enforcement
The licence granted bng.max_sessions = 25000; the working set was 5,000. The
capacity suite verifies the cap is read from the grant and enforced at its
boundary, with sessions beyond it moved to a captive state rather than dropped.
All capacity checks passed. No figure — this is a pass/fail surface, not a
measurement.
5.4 Churn and reconciliation — run-699-churn.json
What it measures. Half the fleet is released and re-established repeatedly
for 300 s, while client-side and controller-side session counts are compared.
Why it matters. Churn is normal ISP life — evenings, link flaps, CPE
reboots. The question is whether the platform's own view of its sessions stays
truthful under it.
| Integrity | 1.0 |
| Converged | yes, in 25.1 s |
| Maximum divergence | 391 sessions |
| Leaked sessions | none (empty list, enumerated) |
| Orphaned sessions | none (empty list, enumerated) |
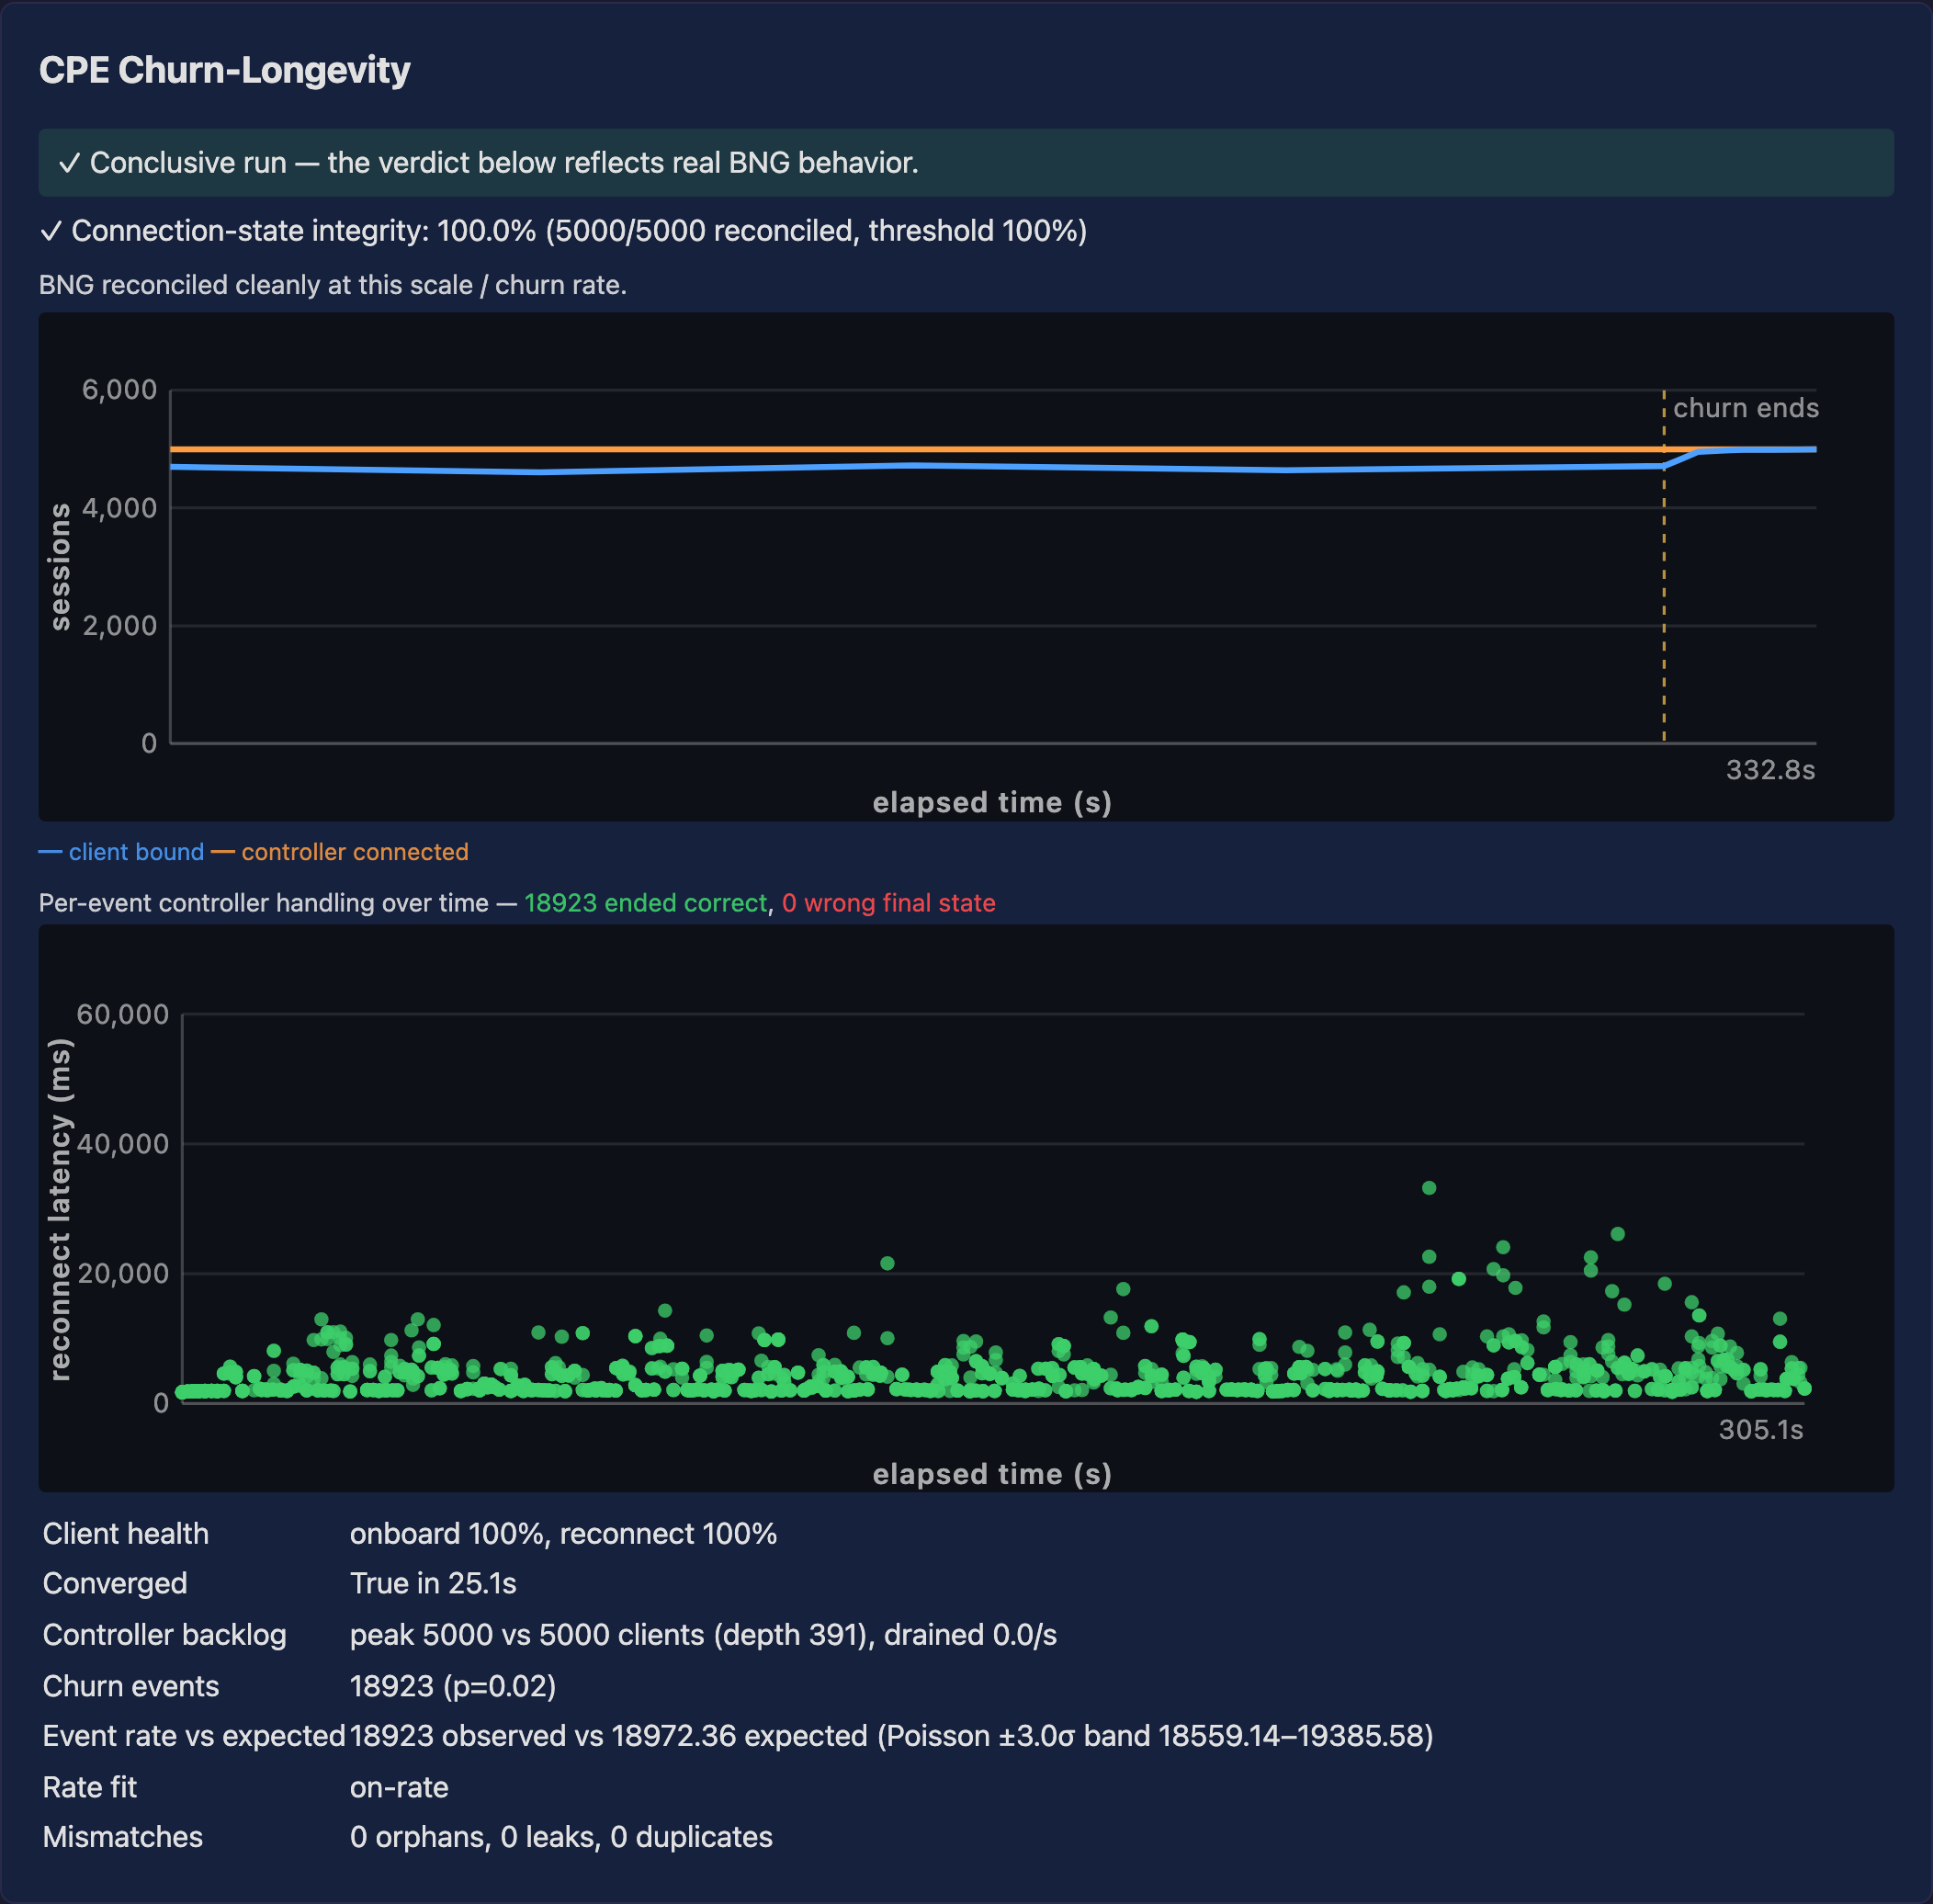
The leak and orphan results are enumerated, not derived. This matters: a
leak count computed as total − final_bound is an arithmetic identity and
proves nothing. These are empty lists of specific sessions, which is evidence.
5.5 Lease churn — run-699-leasechurn.json
What it measures. A cohort is held stable while another half churns around
it, checking the stable cohort is neither disturbed nor lost from the view.
| Cohort size | 2,500 |
| Stable cohort | 2,500 |
| Stable sessions bound | correct throughout |
| Stable sessions in controller view | correct throughout |
| Lease renewal exercised | no |
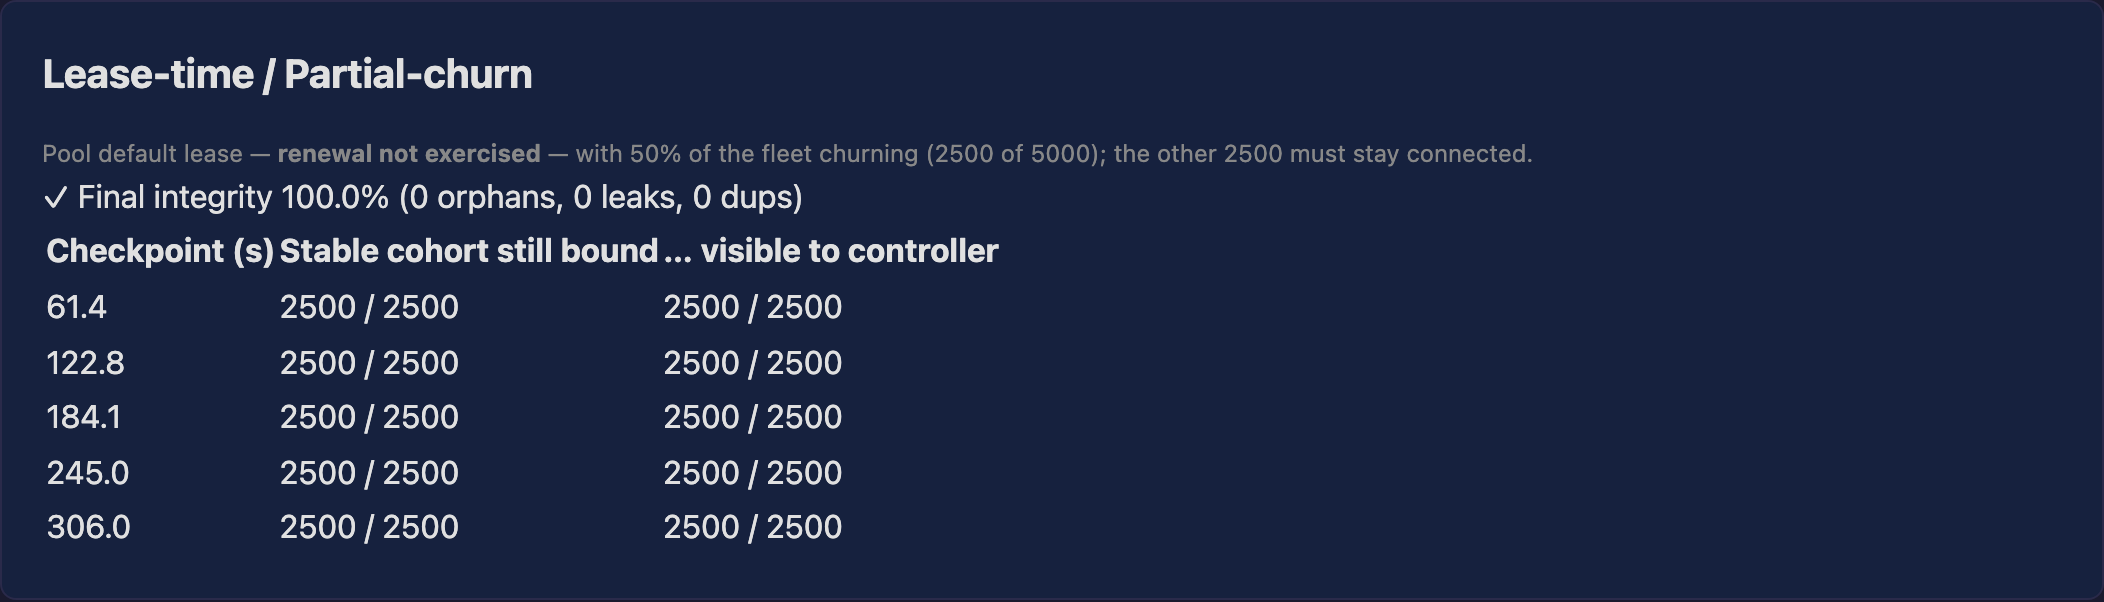
Two caveats, both important. First, the stable cohort was genuinely 2,500 —
worth stating because a stable cohort of zero would make this check pass
while testing nothing. Second, lease_renewal_exercised is false: the lease
time was not shortened for this run, so no lease actually reached renewal inside
the window. The cohort's continuity is real; lease renewal under churn is not
covered by this run.
5.6 Traffic forwarding and QoS — run-699-cpe.json
What it measures. Two distinct workloads, which must not be conflated.
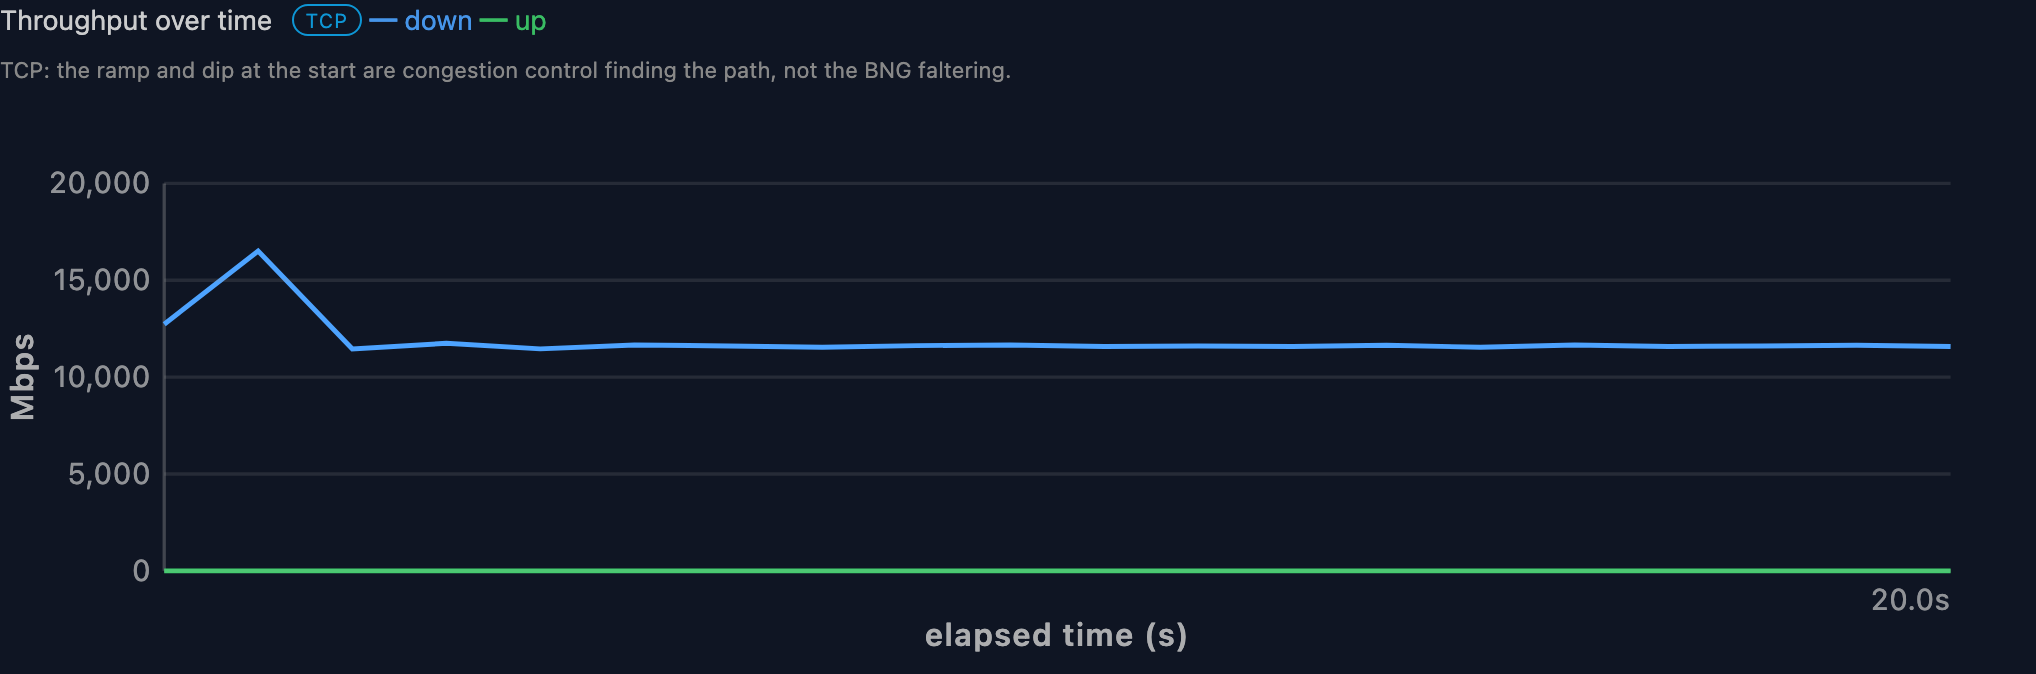
A bulk throughput phase drives downstream HTTP reads to find aggregate
capacity; a separate shaping phase drives per-subscriber traffic through the
policer and compares each subscriber's achieved rate against its plan.
Bulk throughput (downstream)
| Downstream mean | 11,710 Mbps (11.7 Gbps) |
| Downstream peak | 16,505 Mbps (16.5 Gbps) |
| Transferred | 30.17 GB in 20.6 s |
| Upstream | negligible — this phase is a downstream-dominant HTTP read |
Per-subscriber shaping
480 subscribers were sampled and measured in both directions against the
Bronze plan (25 Mbps down / 12 Mbps up ceilings):
| Within contract | 480 of 480 |
| Silent (moved no traffic) | 0 |
| Unresolved | 0 |
| Downstream median | 22.14 Mbps against a 25 Mbps ceiling |
| Upstream median | 10.93 Mbps against a 12 Mbps ceiling |
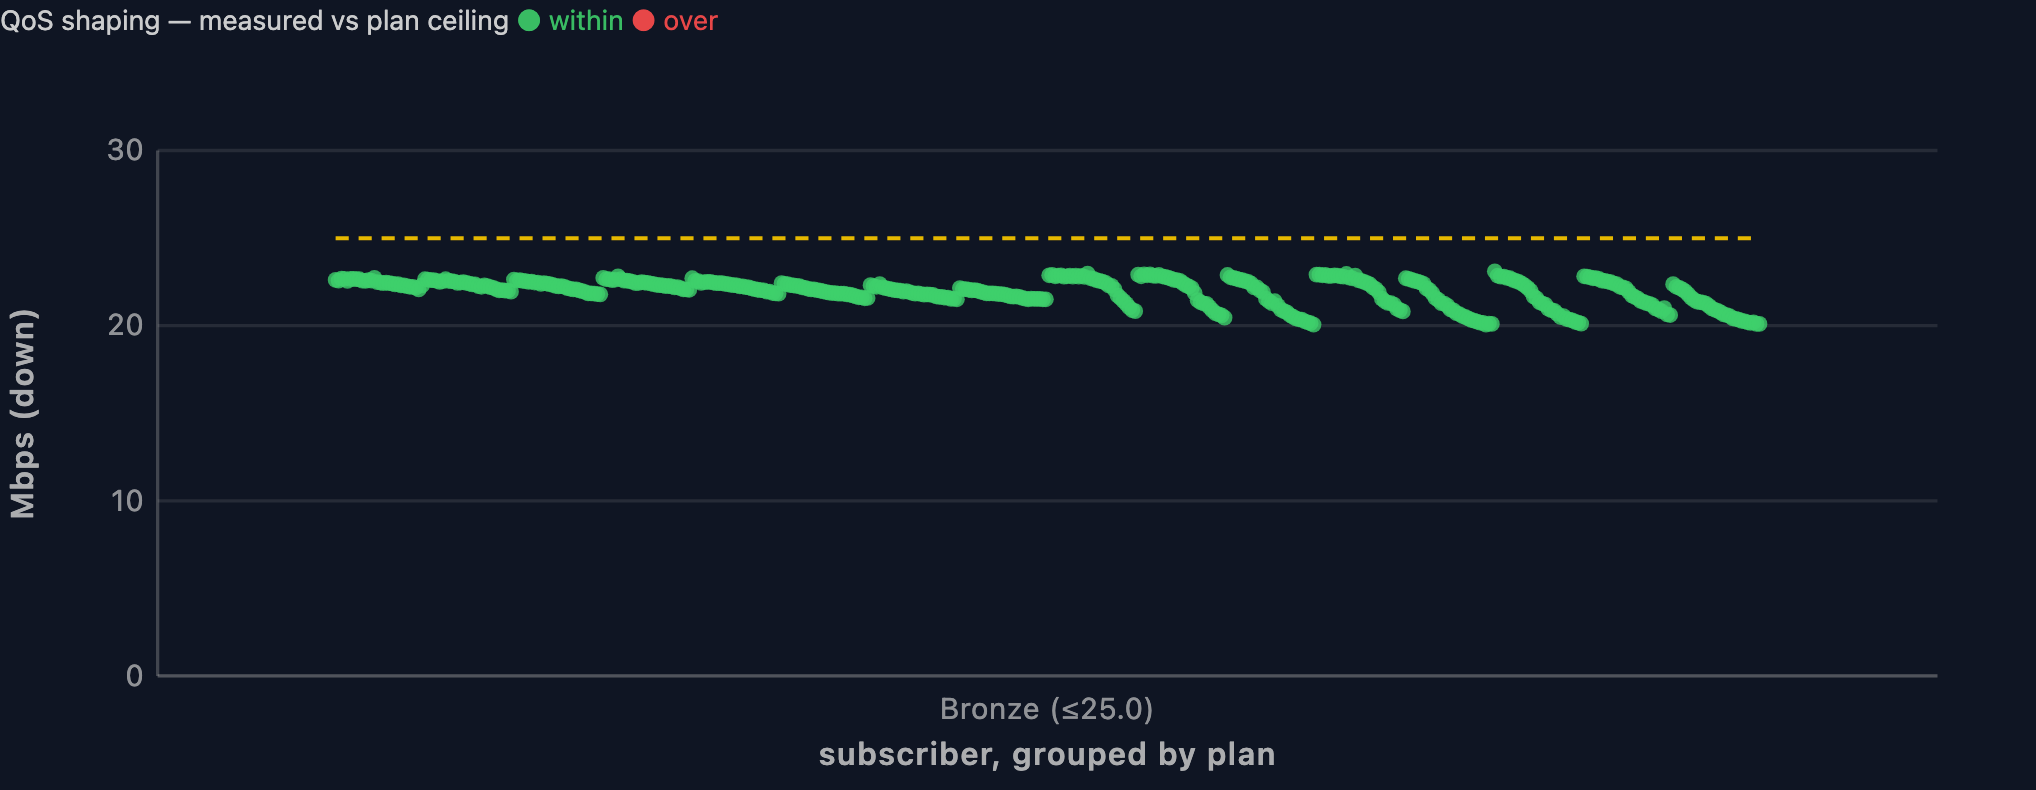
The silent: 0 and unresolved: 0 counts carry weight: a subscriber that moved
no traffic is reported in its own category rather than counted as compliant, so
480 of 480 is 480 real measurements rather than a pass inflated by silence.
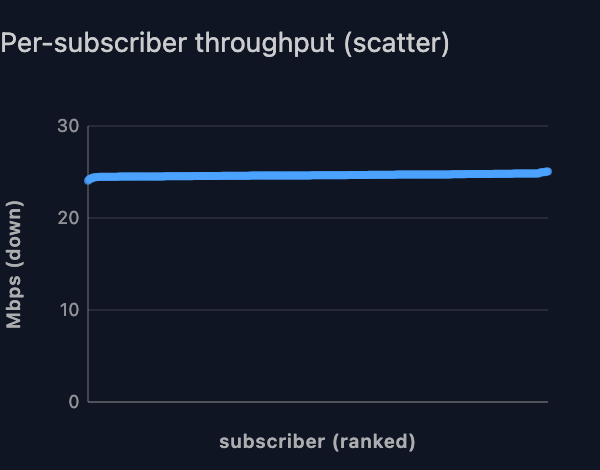
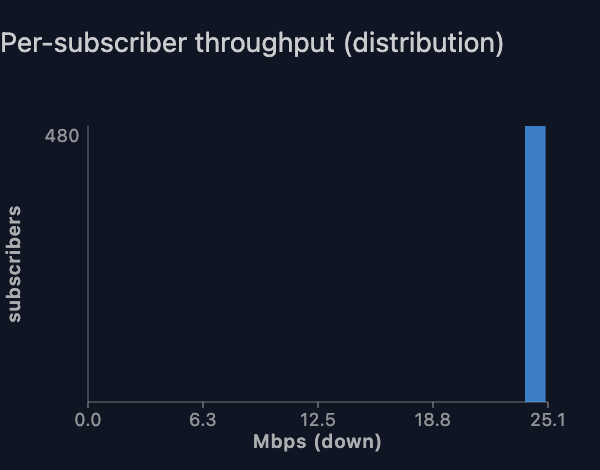
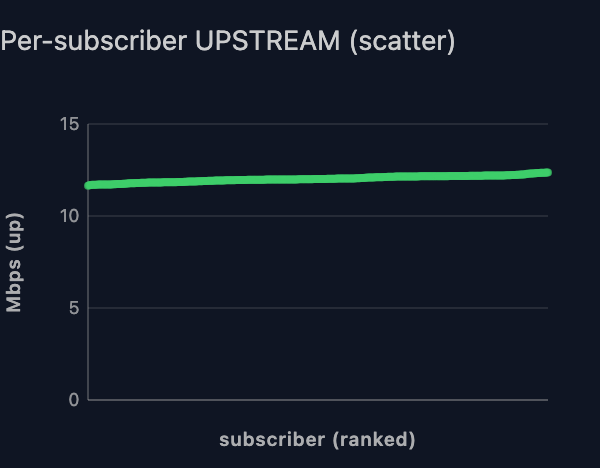
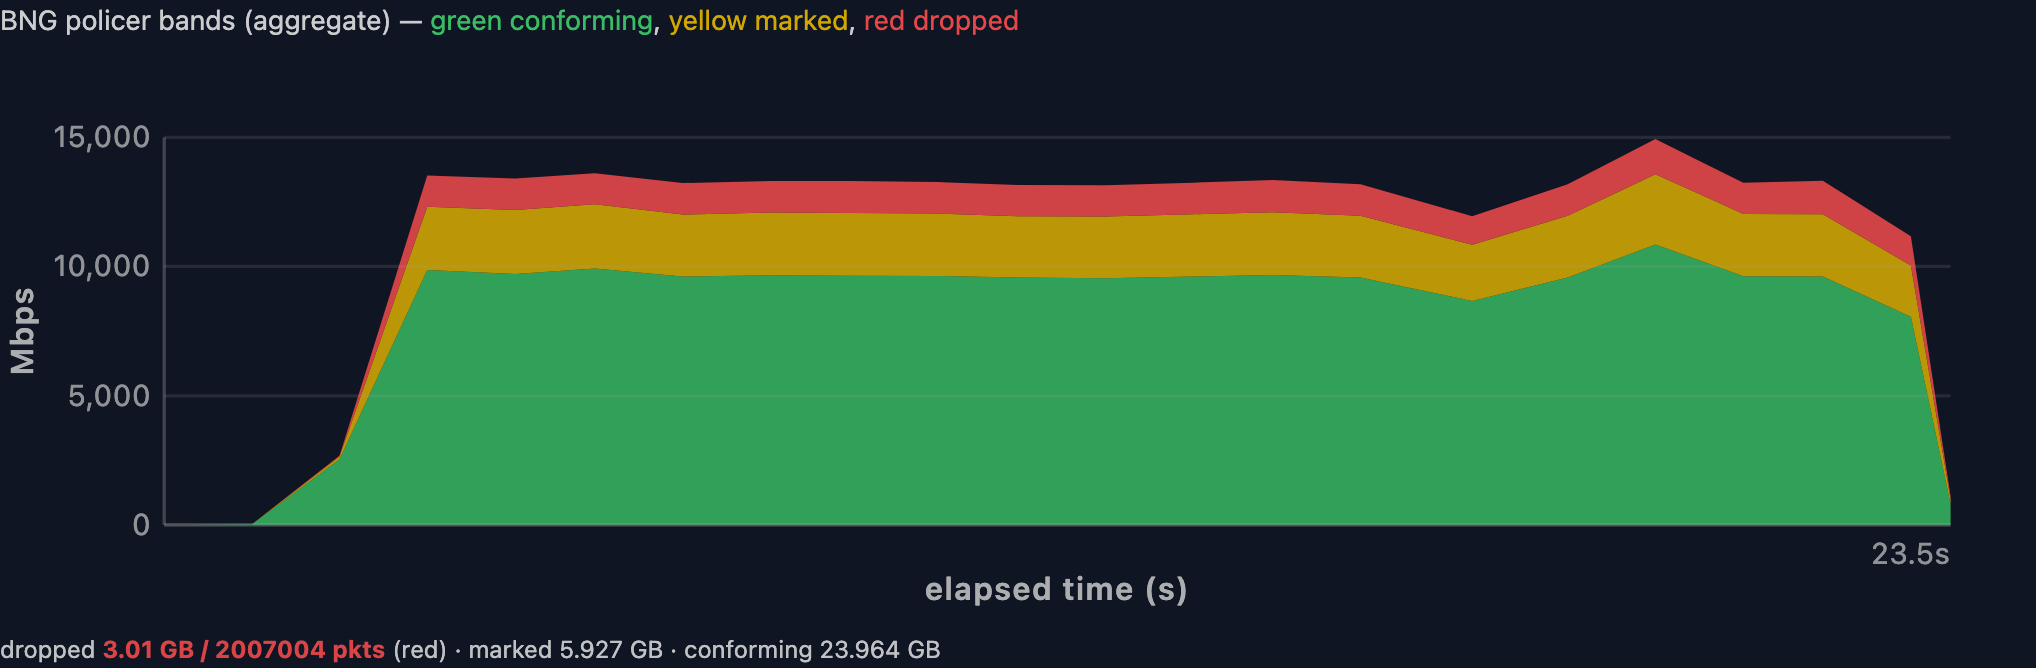
The policer, actively marking
Both directions carried real load through the policer, and the colour split is
the result worth publishing because it shows the policer doing work rather than
merely passing traffic. Figures are the totals the panels themselves report.
Downstream — 32.90 GB over 23.5 s (≈11.2 Gbps mean, ~15 Gbps peak):
| Colour | Volume | Share |
|---|---|---|
| Green (conforming) | 23.964 GB | 72.8% |
| Yellow (marked out-of-contract) | 5.927 GB | 18.0% |
| Red (dropped) | 3.010 GB / 2,007,004 pkts | 9.1% |
Upstream — 30.72 GB over 29.7 s (≈8.3 Gbps mean, ~12.3 Gbps peak):
| Colour | Volume | Share |
|---|---|---|
| Green (conforming) | 19.884 GB | 64.7% |
| Yellow (remarked) | 10.336 GB | 33.6% |
| Red (dropped) | 0.502 GB / 334,895 pkts | 1.6% |
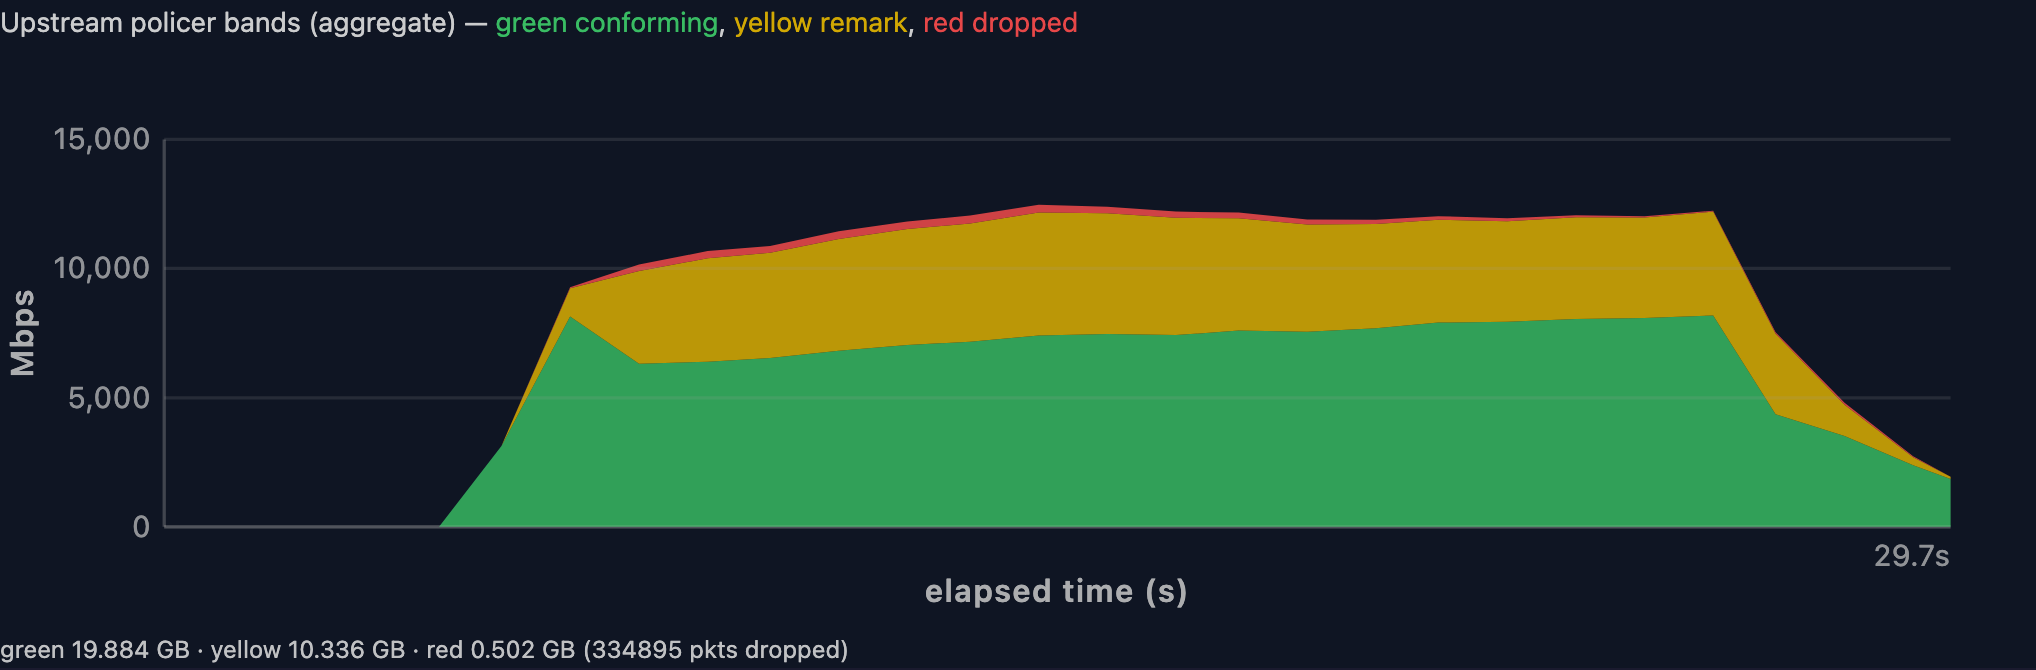
Roughly a quarter of offered traffic downstream, and a third upstream, was
deliberately over-contract, and the policer classified every bit of it. That is
the enforcement path working end to end under multi-gigabit load in both
directions, not an idle-path check.
What this run does not establish. Neither direction is a search for a
forwarding ceiling — these are the shaping workload's offered rates, chosen to
exercise the policer. §5.7 is where forwarding limits are measured.
5.7 Forwarding performance and core scaling — run-699-coreperf.json
What it measures. A matrix of worker counts (1–5) against packet sizes
(64B, 128B, 512B, 1518B, plus a TCP profile), each cell recording throughput,
per-core efficiency, thread balance, and what limited it.
This is the section most easily misread, so start with the taxonomy. The
matrix covers 20 UDP cells — five worker counts against four frame sizes —
and sorts each into one of three kinds, which are not interchangeable:
| Kind | Cells | What it means |
|---|---|---|
| BNG ceiling | 4 | the box dropped packets — a real forwarding limit |
| Line rate, zero loss | 13 | the box forwarded everything offered, at 90% of link, with zero loss |
| Floor — rig under-offered | 3 | the box kept up but the rig never filled the link |
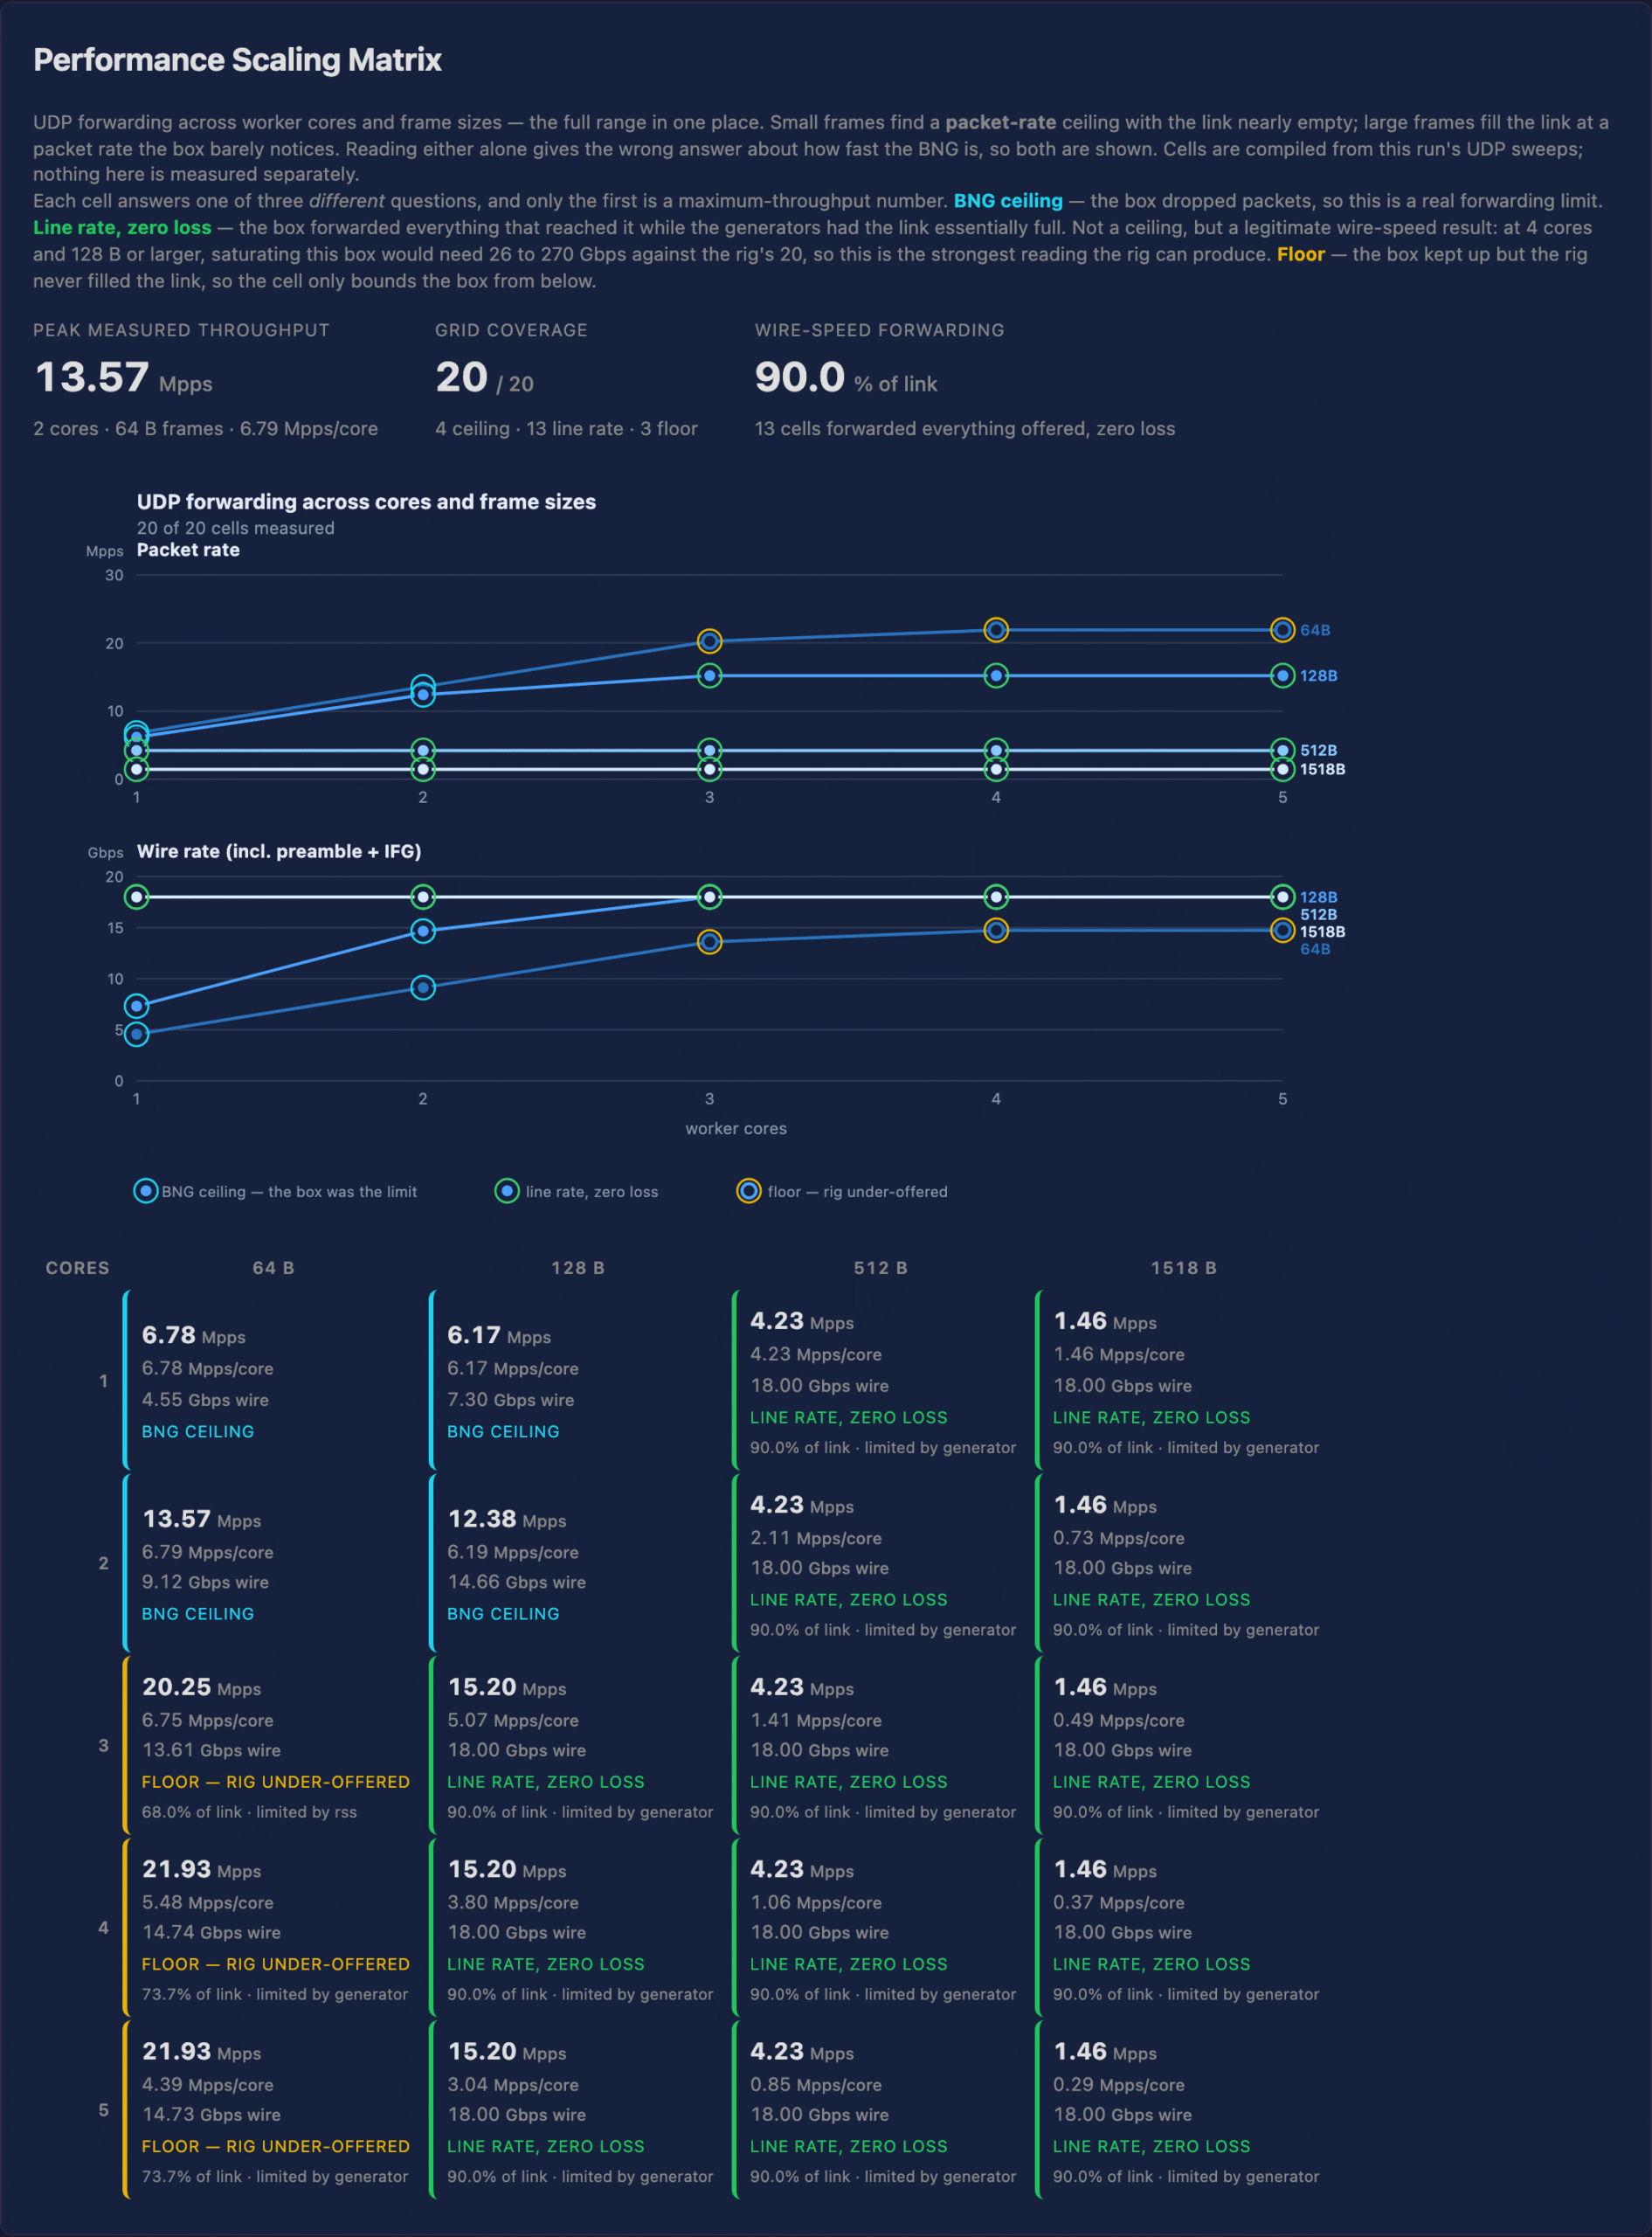
Only the 4 ceiling cells are maximum-throughput numbers. But the 13
line-rate cells are not merely "our generators ran out" either — they are
legitimate wire-speed results: the box forwarded every packet that reached it
while the link was essentially full. At 4 workers and 128 B or larger,
saturating this box would need 26 to 270 Gbps against the rig's 20, so those
cells are the strongest reading this rig can produce rather than a shortfall.
Only the 3 floor cells are genuine under-offers.
The run's JSON additionally carries 4 TCP-profile cells, which the matrix does
not render; all four are generator-limited and no figure in this report is drawn
from them.
Only these four cells measure the platform:
| Workers | Packet size | Throughput | Per core | Cycles/packet |
|---|---|---|---|---|
| 1 | 64B | 6.78 Mpps | 3.25 Gbps | ~330 |
| 1 | 128B | 6.17 Mpps | 6.12 Gbps | ~344 |
| 2 | 64B | 13.57 Mpps | 3.26 Gbps | ~330 |
| 2 | 128B | 12.38 Mpps | 6.14 Gbps | ~345 |
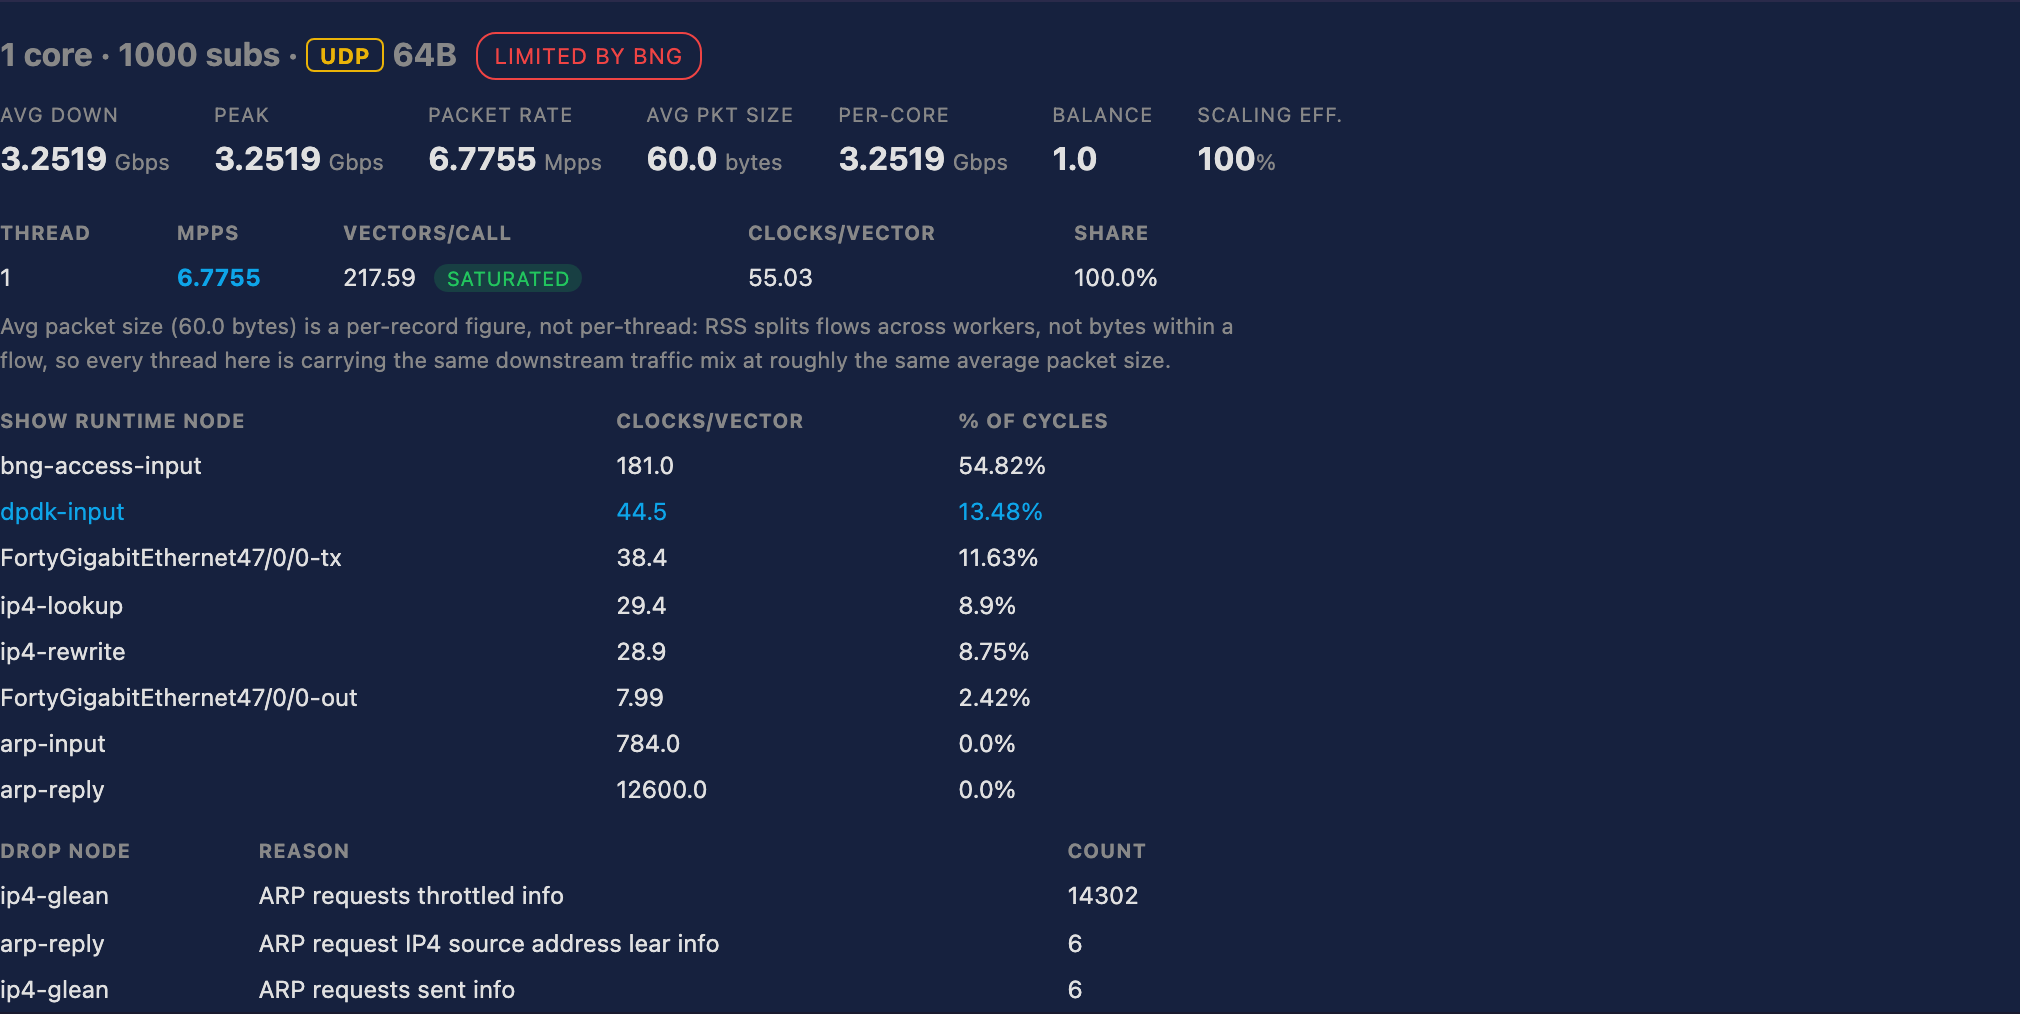
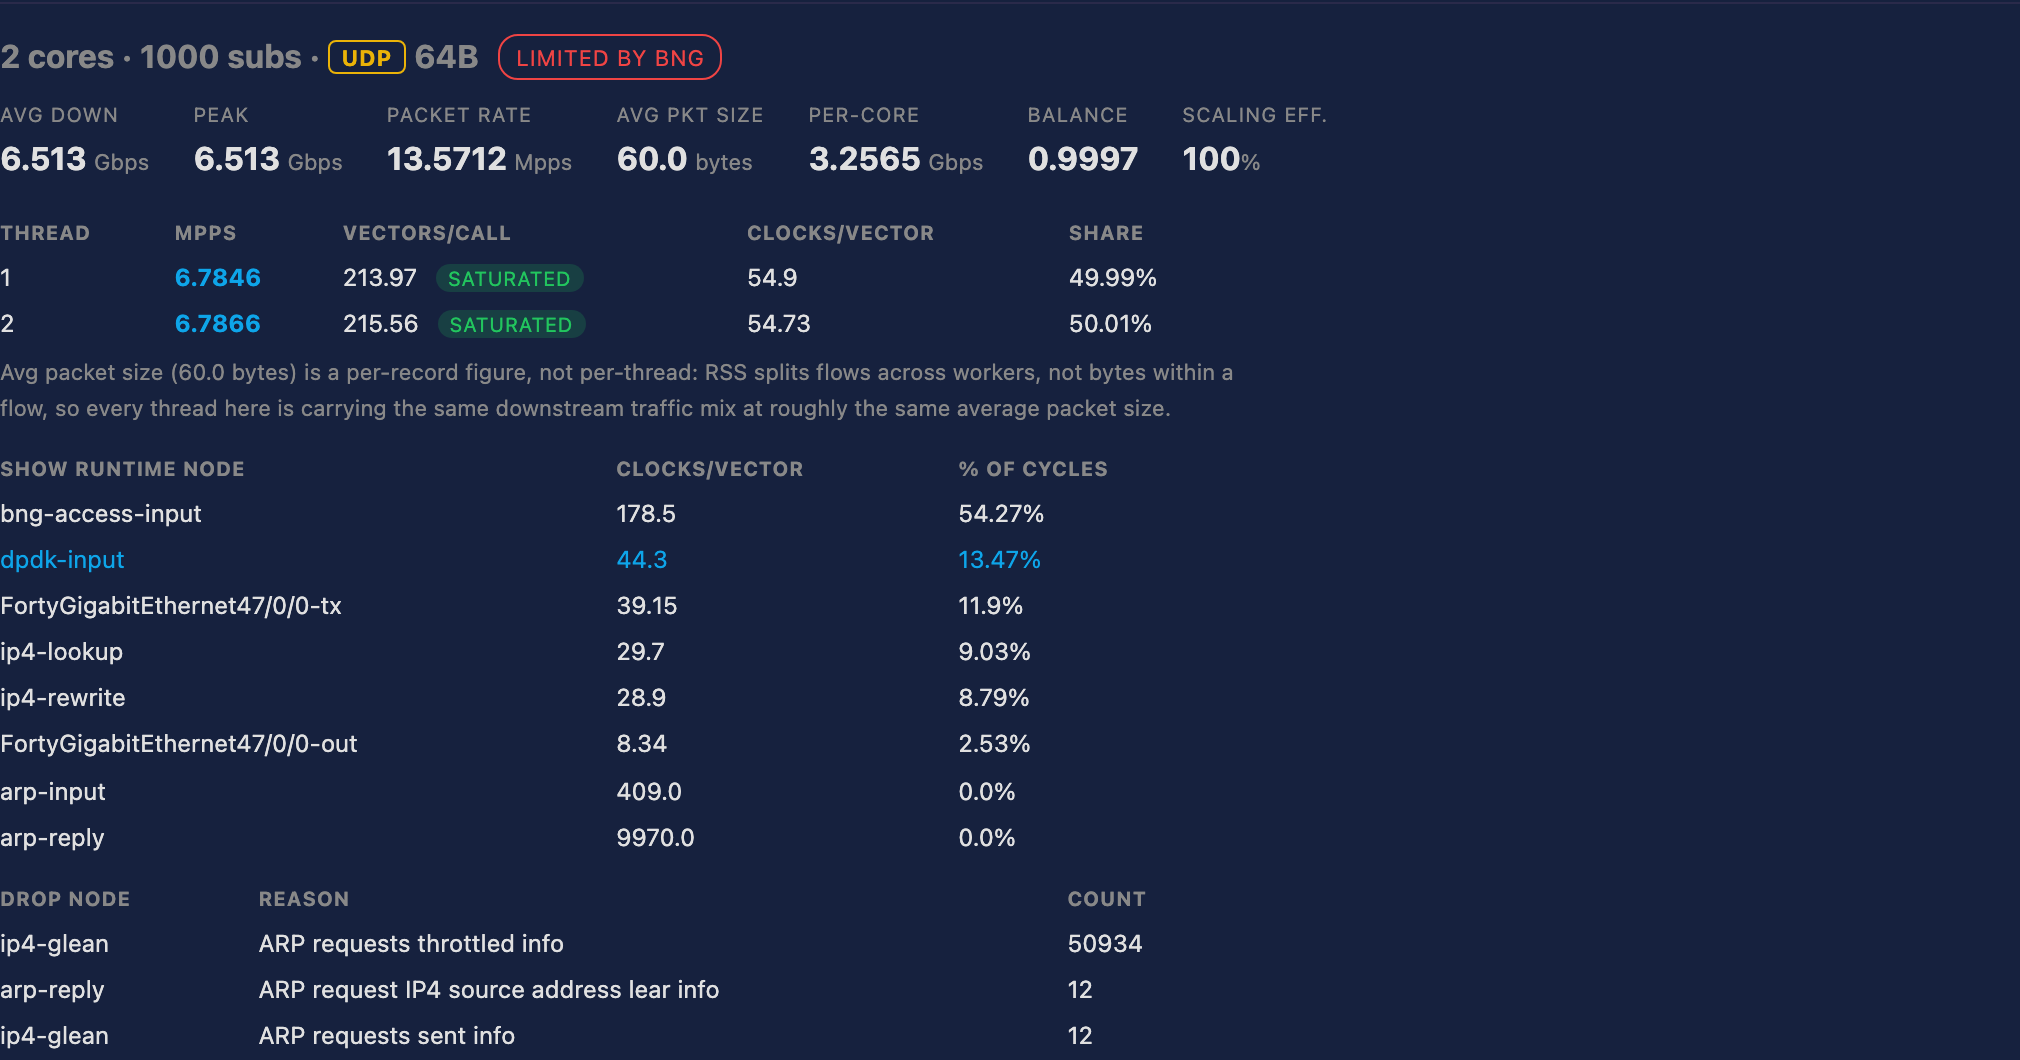
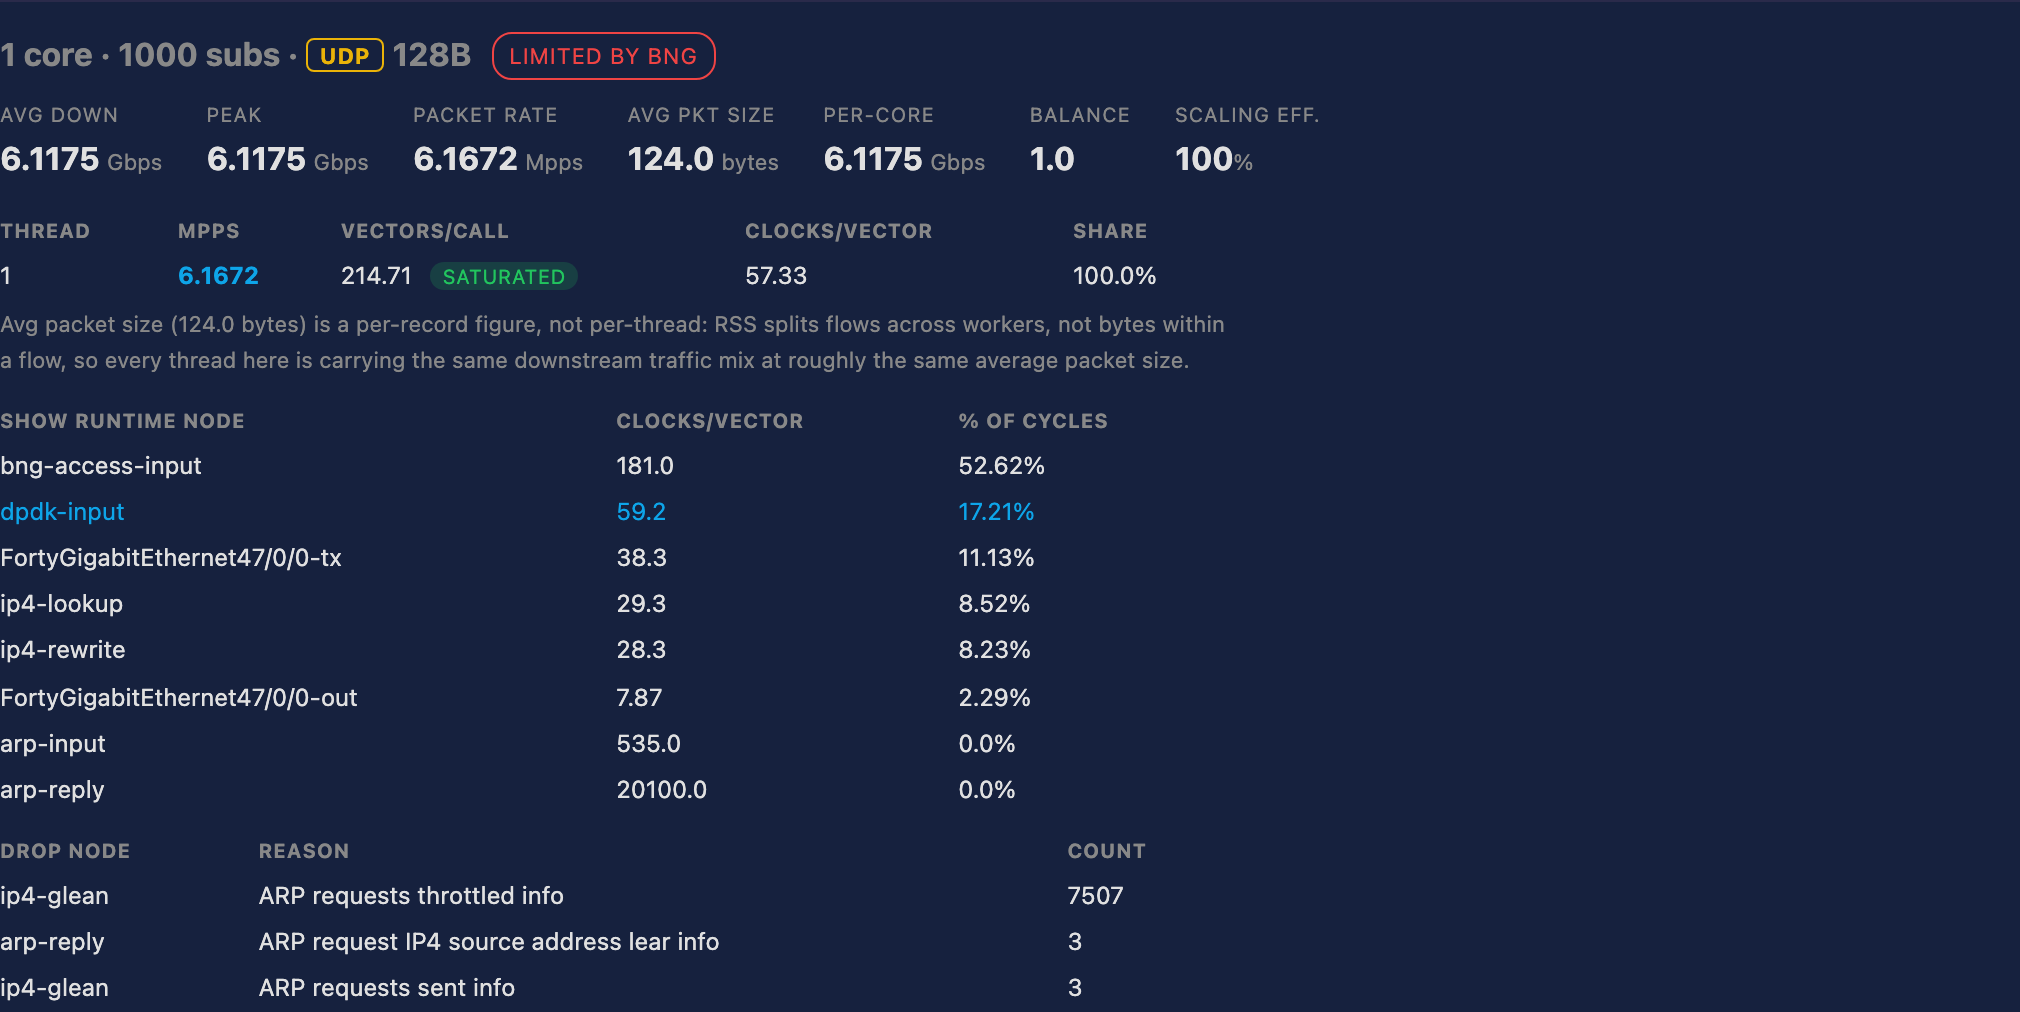
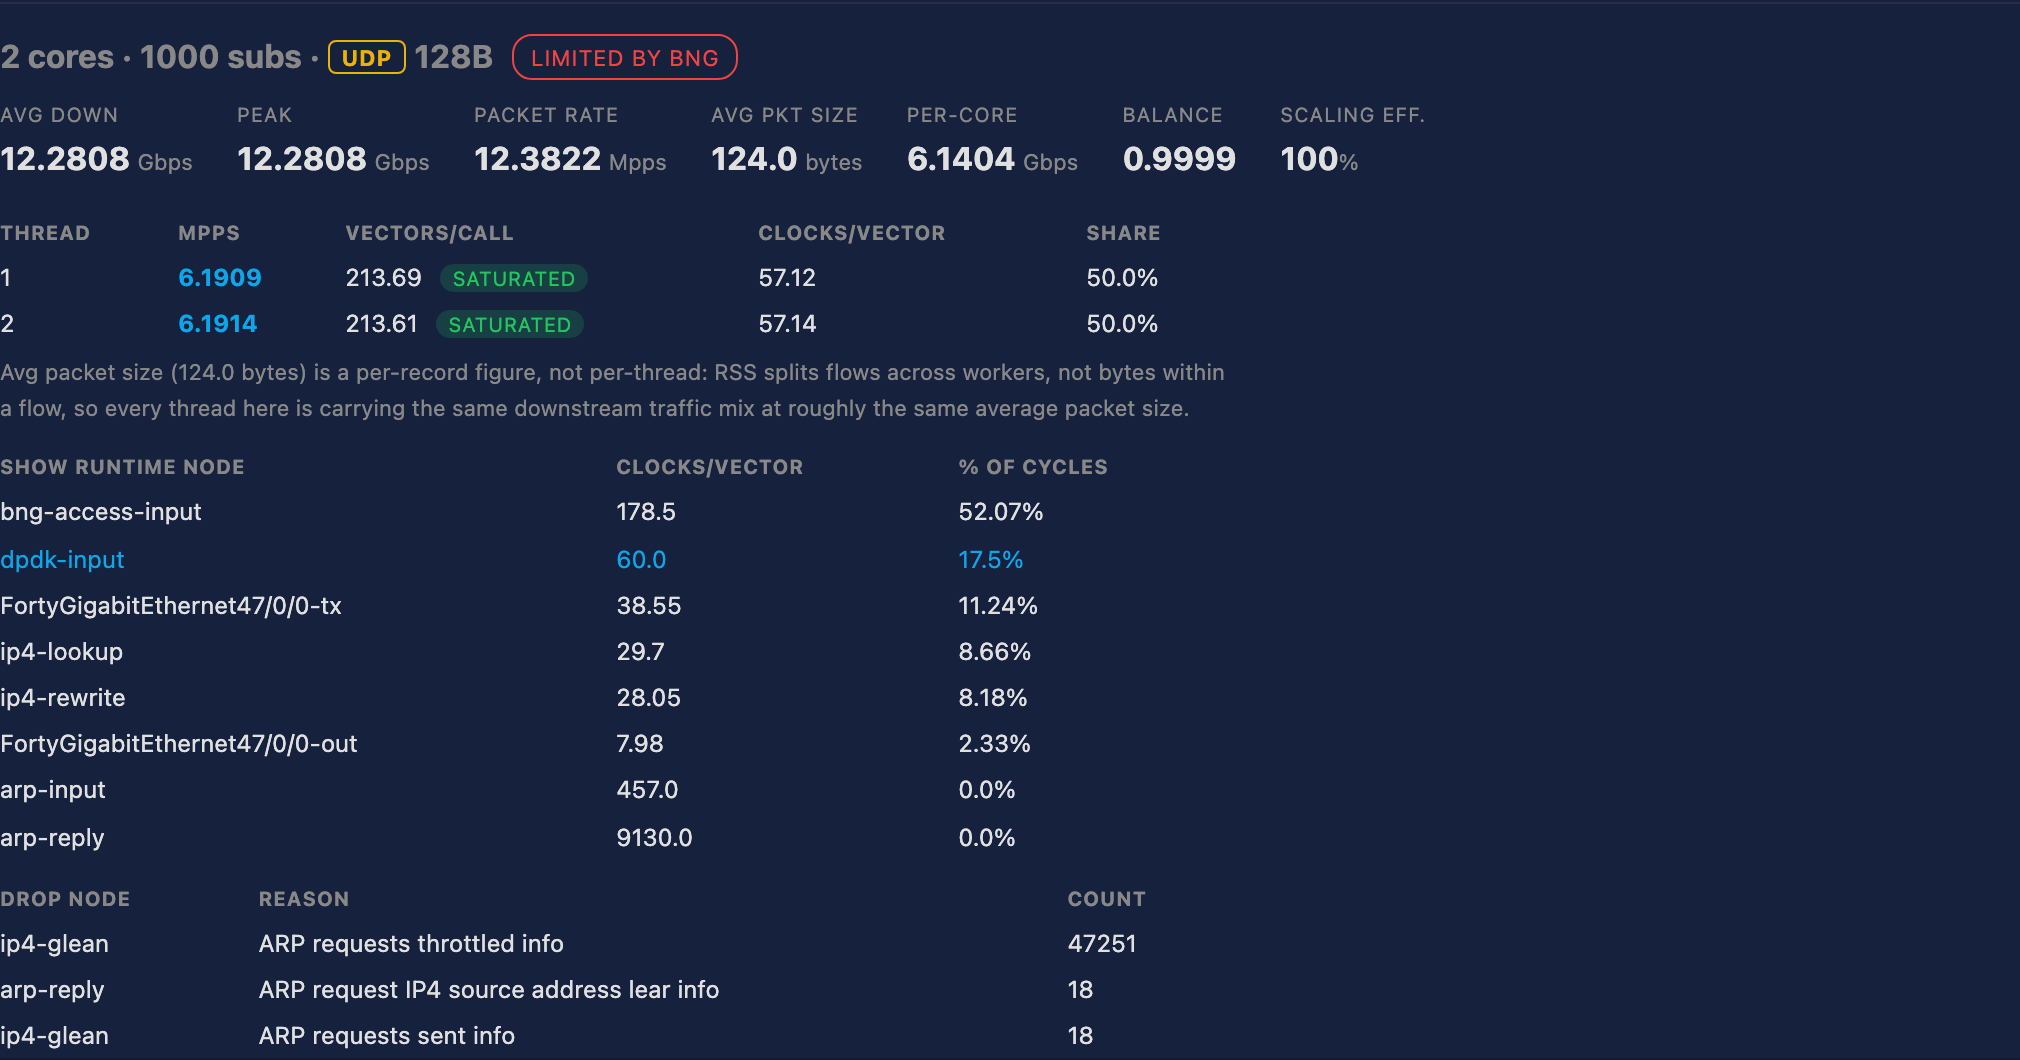
Scaling from one worker to two is near-linear — 6.78 → 13.57 Mpps at 64B is
2.00×, and per-core throughput is unchanged (3.25 → 3.26 Gbps). That is the
useful result in this section: the forwarding path scales with cores rather than
contending.
Per-packet cost is measured, not derived. clocks_per_vector × nodes_per_packet gives ~330 cycles per packet at 64B. This is the most durable
efficiency figure in the report because it survives hardware comparison: on a
2.0 GHz core, 330 cycles is ~165 ns of CPU per packet.
Thread balance is 0.9997–1.0 across the multi-worker cells, confirming the
one-queue-per-worker placement in §3.3 distributes evenly.
The generator ceiling is demonstrated, not merely asserted. A
platform-limited number rises when workers are added. The generator-limited
cells do not move at all — they are byte-identical across every worker count:
| Packet size | 1 worker | 2 | 3 | 4 | 5 |
|---|---|---|---|---|---|
| 512B | 4.229 Mpps | 4.229 | 4.229 | 4.229 | 4.229 |
| 1518B | 1.463 Mpps | 1.463 | 1.463 | 1.463 | 1.463 |
| 128B | bng | bng | 15.2 | 15.2 | 15.2 |
| 64B | bng | bng | rss | 21.93 | 21.93 |
Five different dataplane configurations returning one identical figure is the
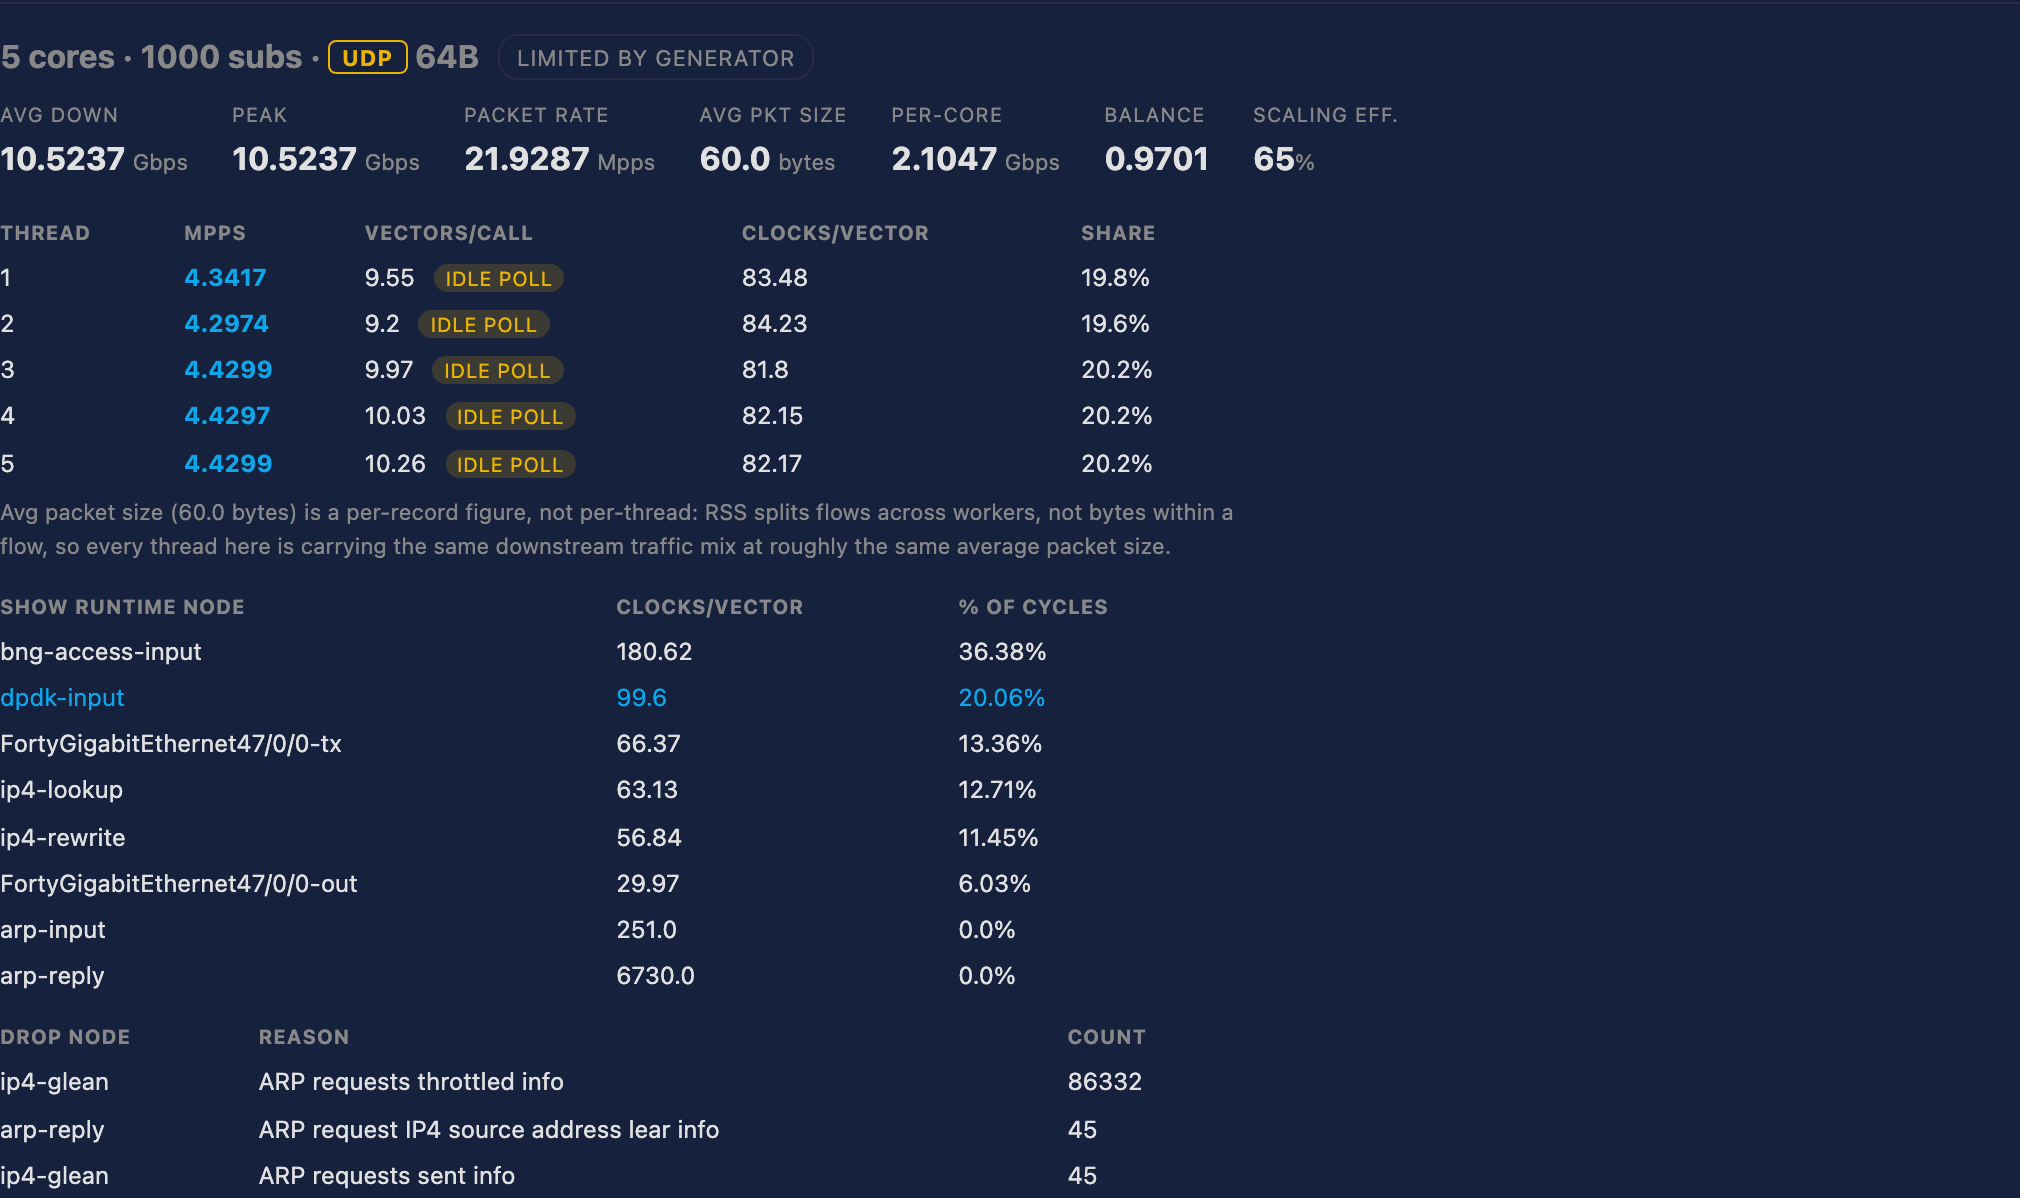
signature of a constraint that is not the dataplane. The rig's ceilings are
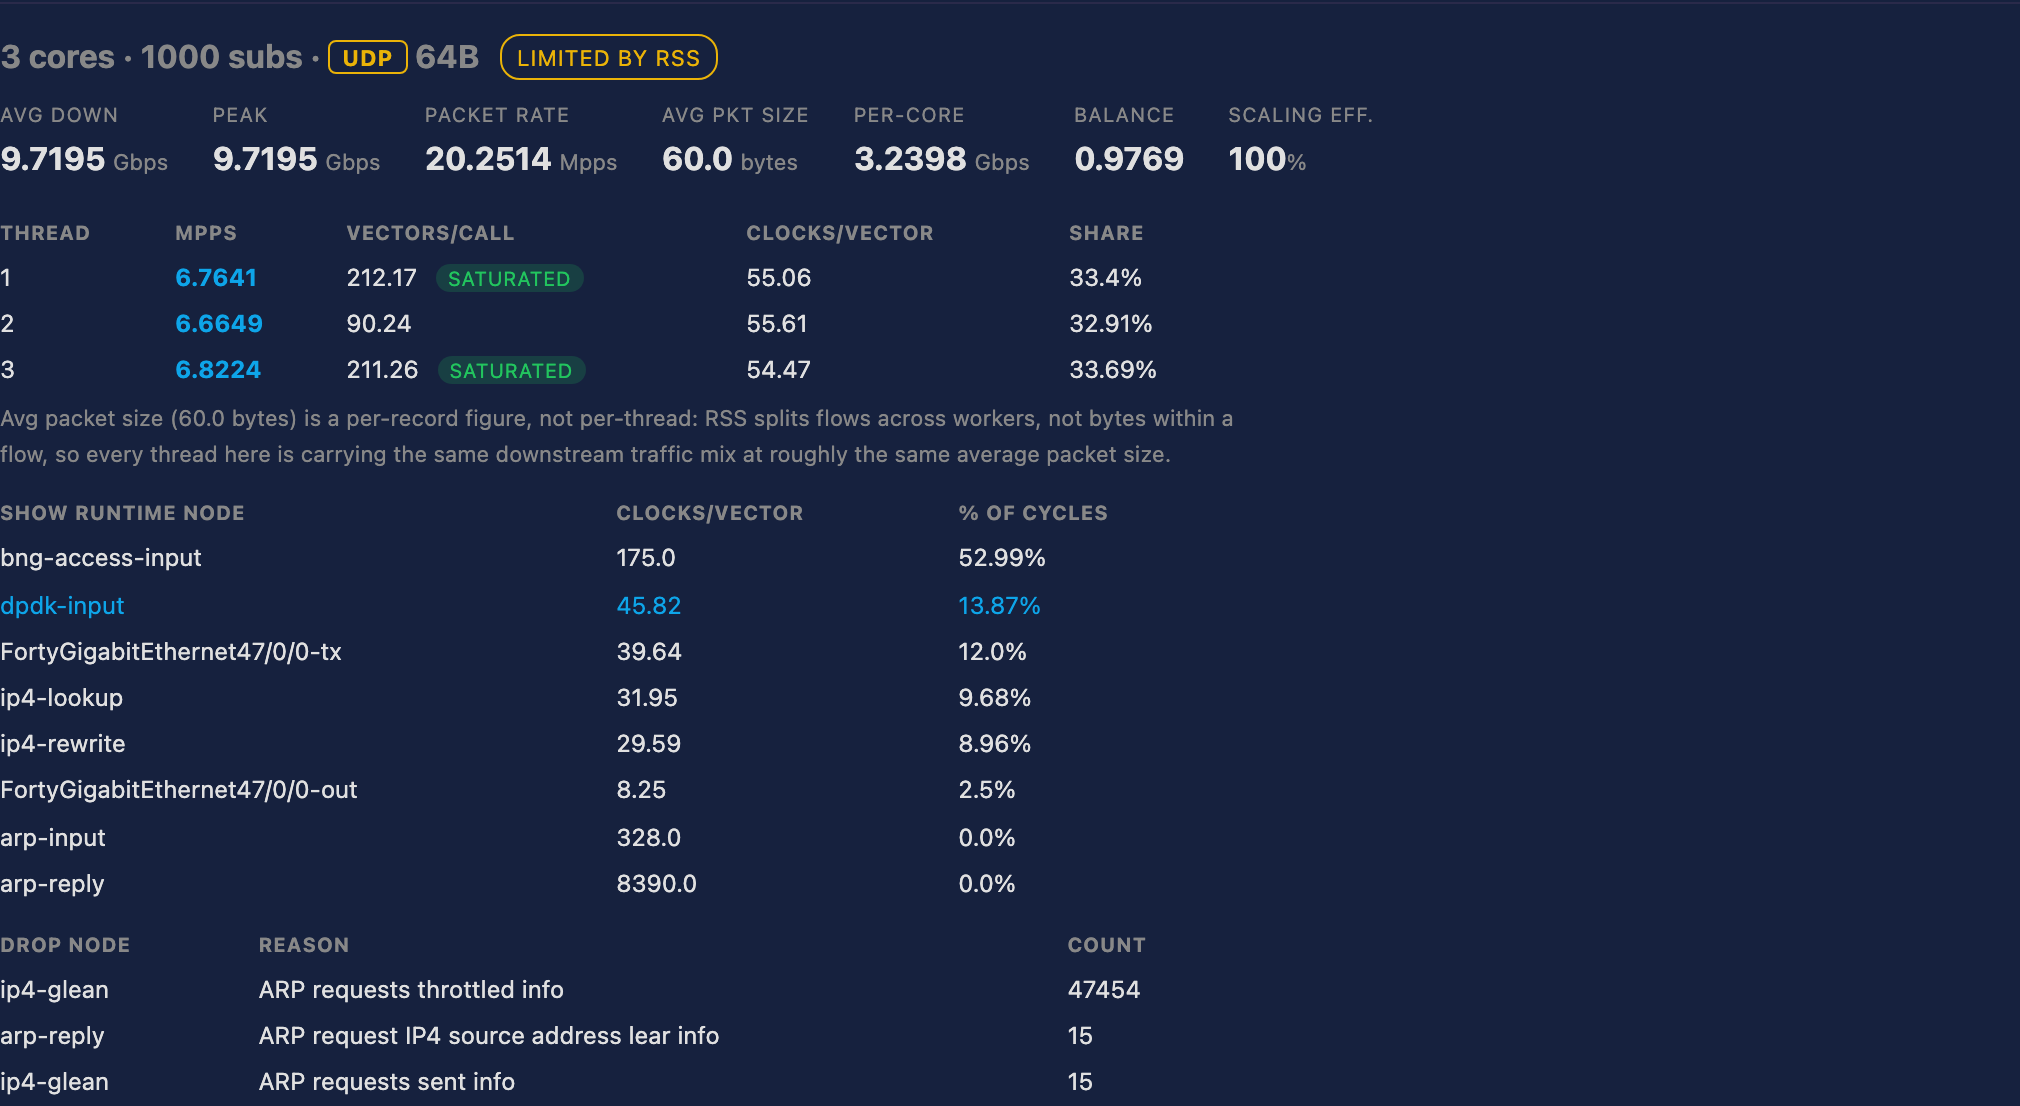
~20 Gbps aggregate, 15.2 Mpps at 128B and 21.93 Mpps at 64B.
For the 512 B and 1518 B rows this is line rate with zero loss: the box
forwarded every packet offered while the link was essentially full. Saturating
it at those frame sizes would need far more than the rig's 20 Gbps, so the cells
are the strongest reading available here, not a shortfall. The 64 B cells at
four and five workers are the genuine floors — there the rig simply under-offered.
Beyond two workers the 64 B cells stop finding a platform ceiling. At three
workers that cell becomes RSS-limited; at four and five the rig under-offers:
5.8 Local-AAA performance — run-699-aaa.json
What it measures. Four experiments against the platform's own subscriber
store, each carrying its own limited_by.
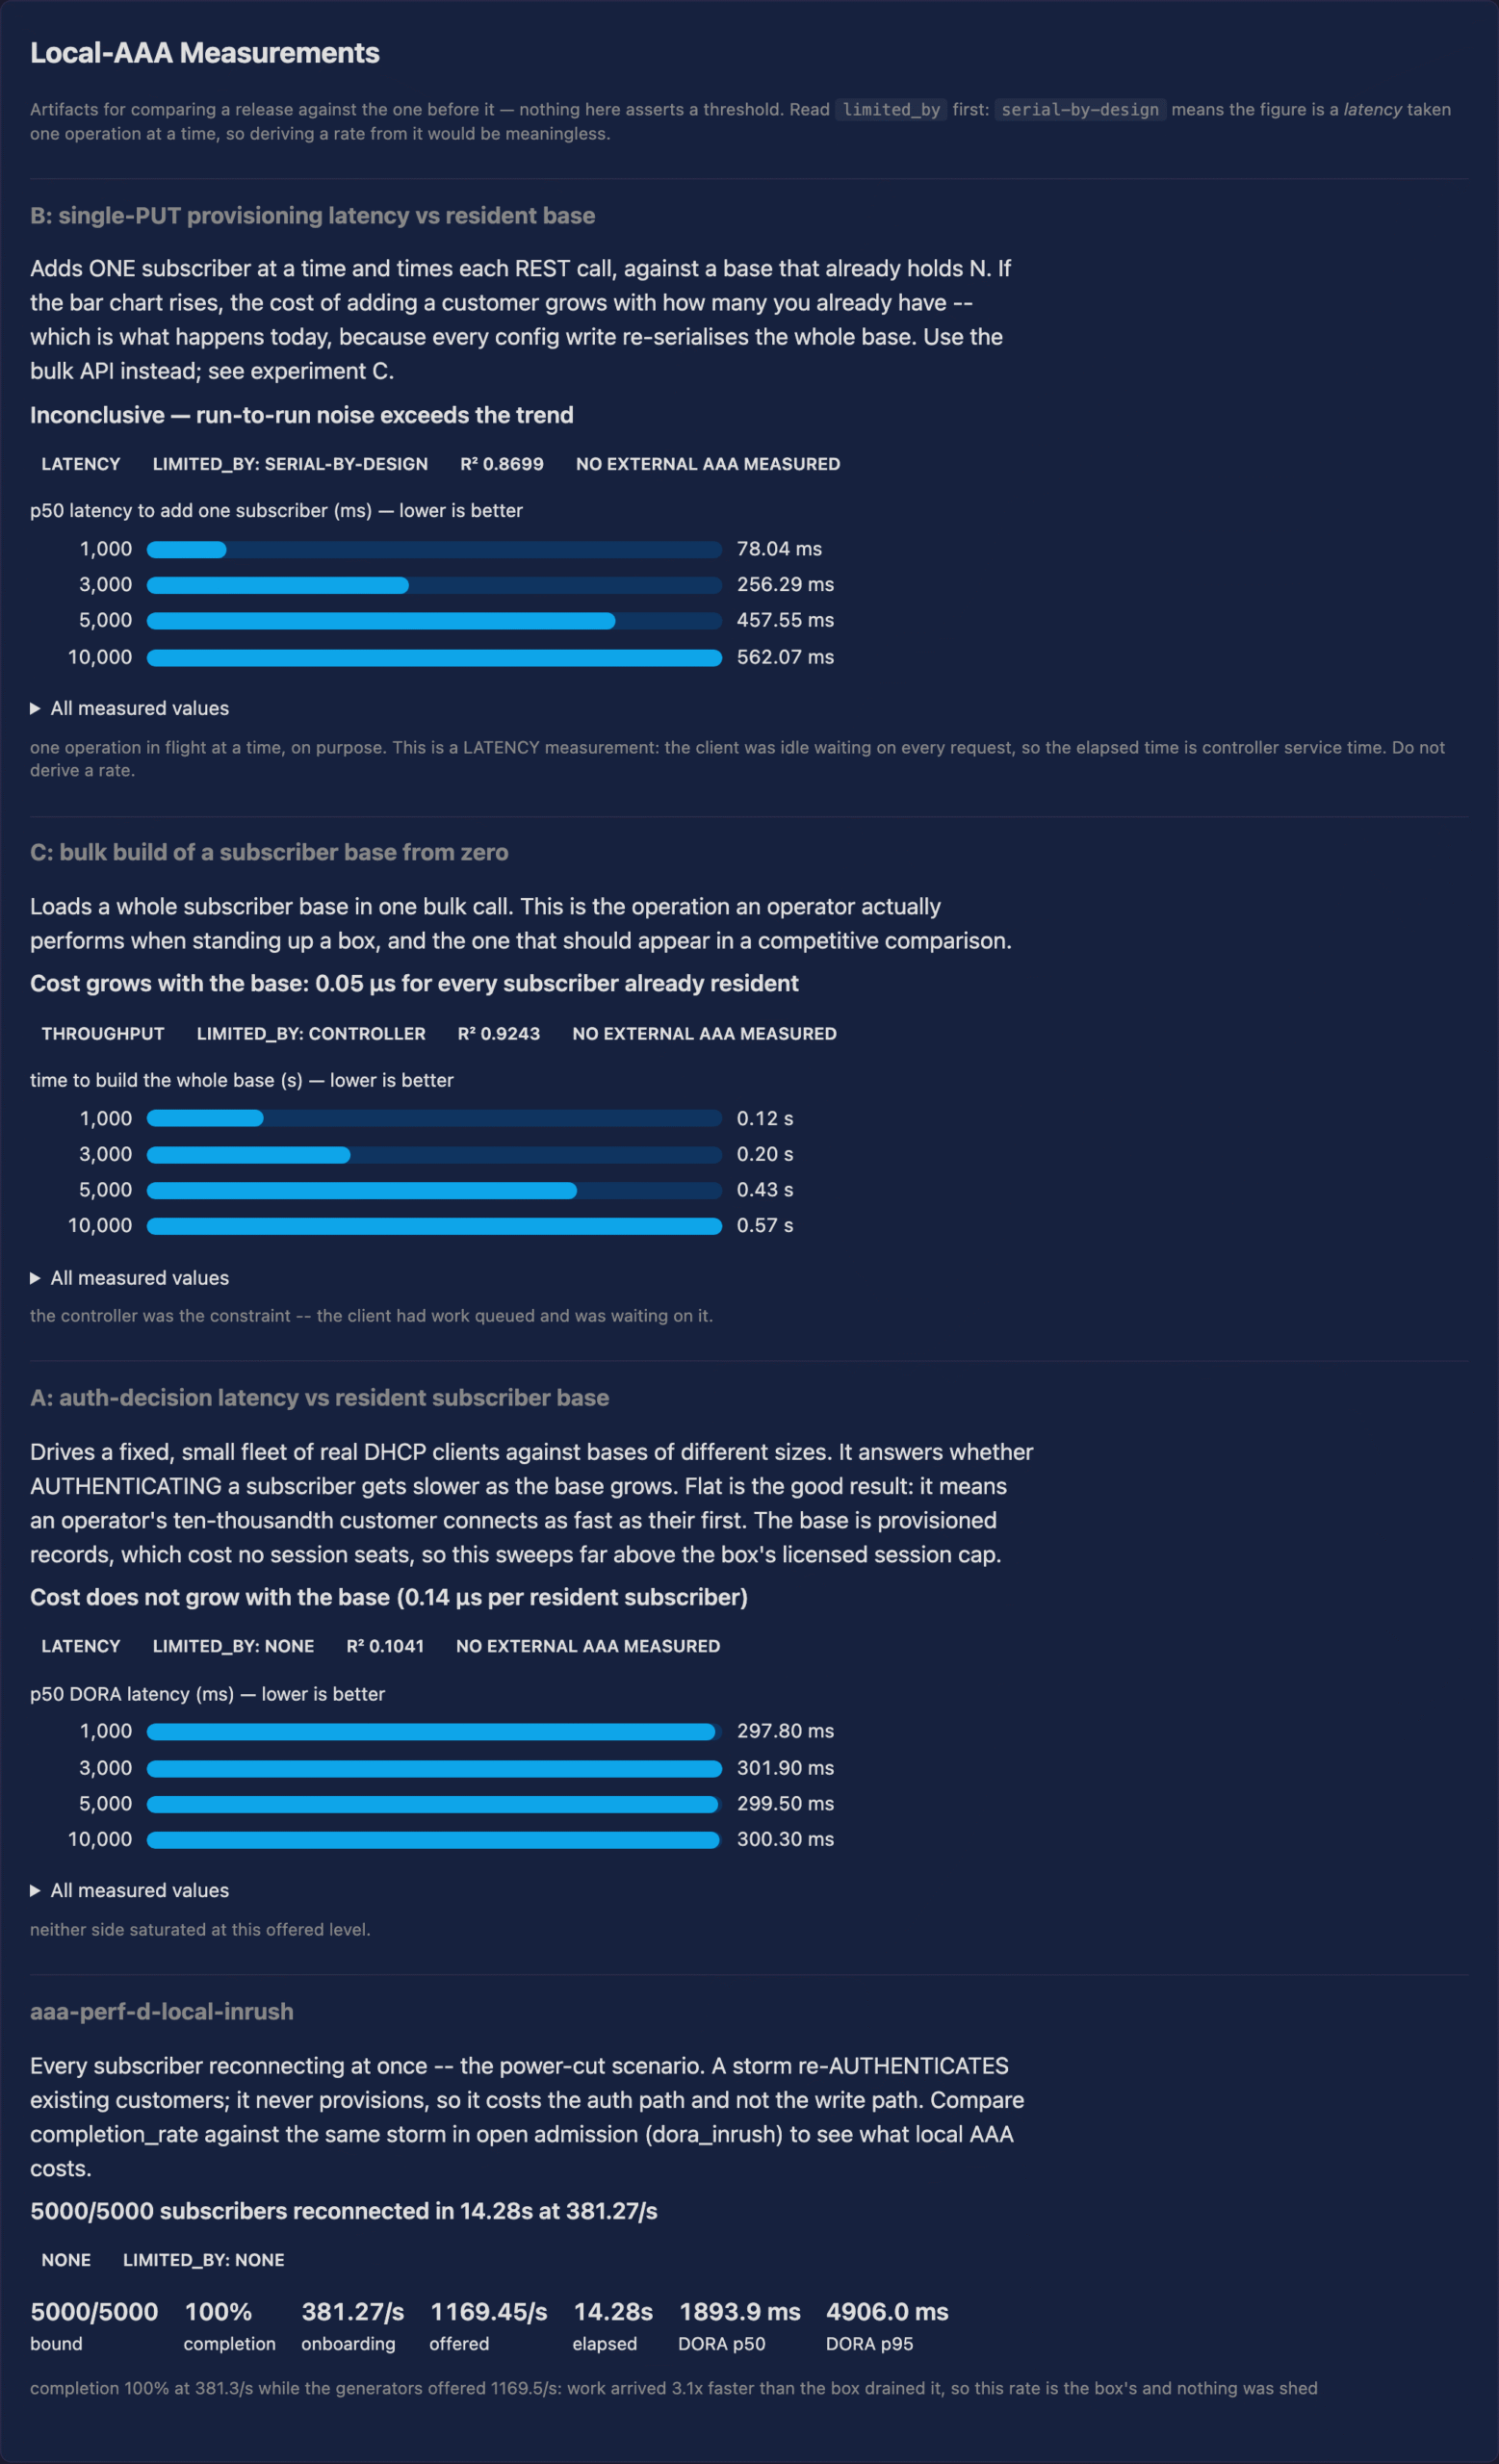
A — authentication latency. limited_by: none. Cost is flat in the
resident base: 0.14 µs per resident subscriber with r² = 0.10, i.e. no
meaningful slope. Across the measured sweep — bases of 1,000, 3,000, 5,000 and
10,000 — p50 DORA latency sits between 297.8 ms and 301.9 ms. Authenticating
against the largest base measured costs what it costs against the smallest. The
sweep does not extend to the 25,000 licensed cap.
B — single-subscriber provisioning. limited_by: serial-by-design — one
operation in flight on purpose. This is a latency measurement and must not be
read as a provisioning throughput figure.
C — bulk base build. limited_by: controller, so publishable with the
component named. Build time is linear in the resident base (O(N)): 0.05 µs
per resident subscriber, r² = 0.92. Adding one subscriber costs more as the base
grows — relevant when planning bulk imports.
D — local-AAA in-rush. 5,000 of 5,000 bound, completion 100% at
381.3/s, with offered_headroom = 3.07: work arrived 3.1× faster than the
box drained it, so this rate is the platform's own.
The cost of local-AAA admission. Comparing D against the open-admission
cold in-rush in §5.2 — the same storm, differing only in admission — gives
381.3/s against 391.8/s. Local-AAA admission costs 2.7%. This is the only
clean measurement of it in the suite.
5.9 Unauthenticated admission — run-699-unauth.json
What it measures. A layered probe: ICMP, TCP and HTTP from identities at
varying degrees of legitimacy, verifying the walled garden admits what it should
and no more.
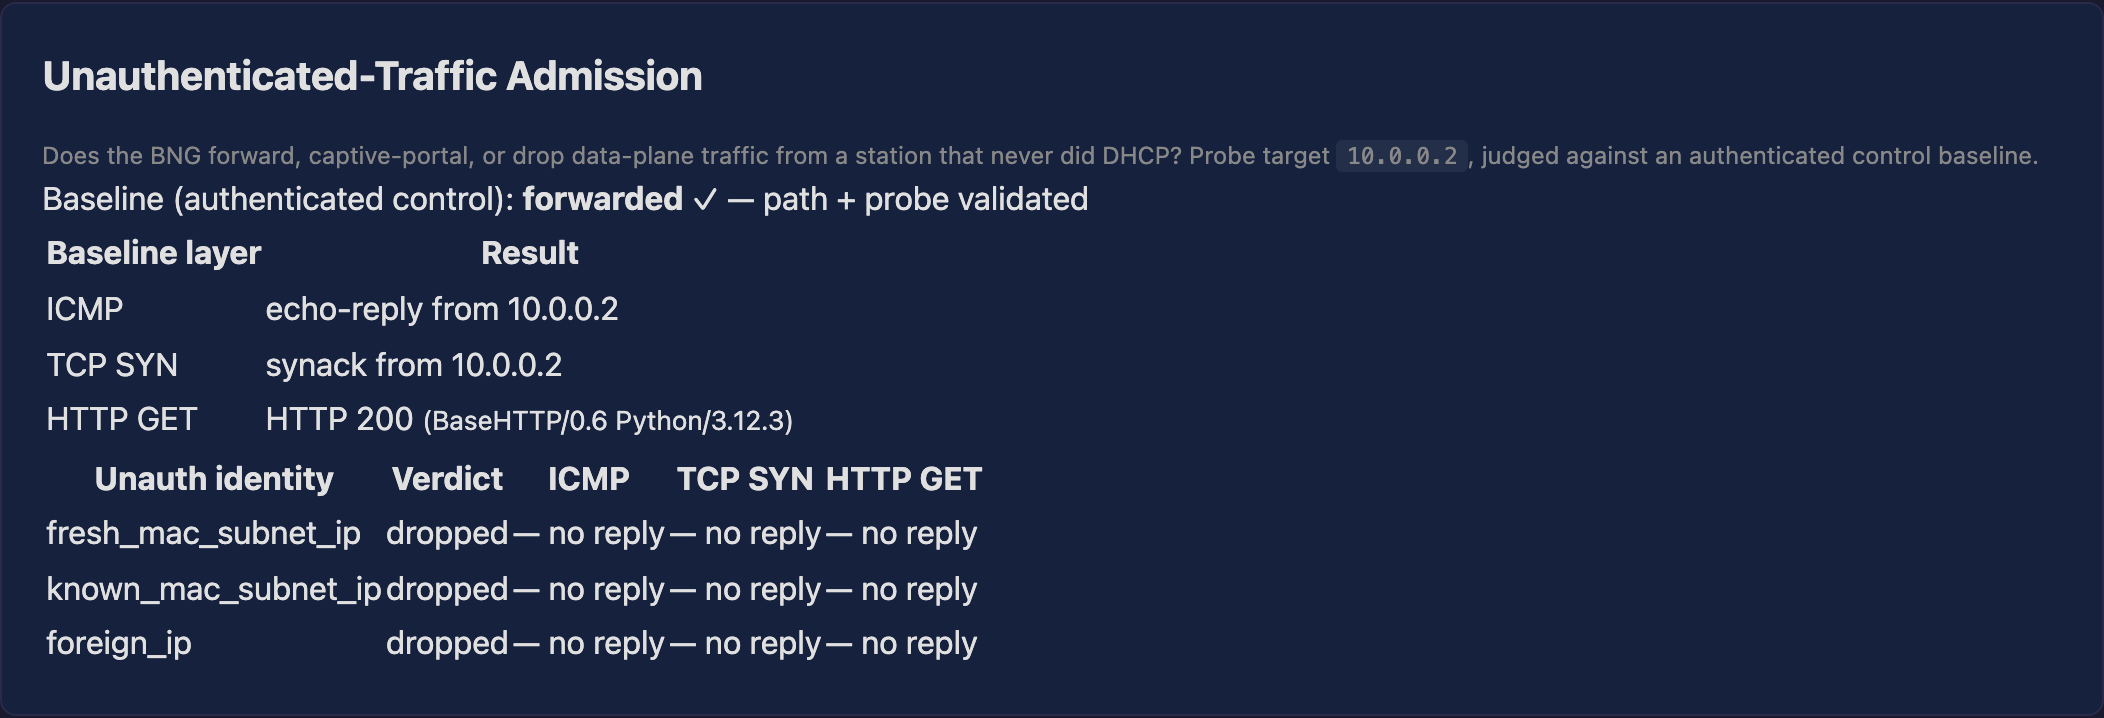
The baseline identity forwarded correctly at all three layers (ICMP echo-reply,
TCP SYN-ACK, HTTP 200), establishing that the probe itself works before the
restrictive cases are read. All admission checks passed.
5.10 Management surface
The console, licence API, security and authentication suites all passed, with
two exceptions recorded in §6. These cover API key handling, role enforcement,
session security, licence activation and the console's own rendering.
6. Known limitations and non-passing checks
6.1 One failure — the dataplane NIC attribution check
test_vpp_owns_dataplane_nics failed. It is a true positive, and it is the
only failing check in the run.
The console sorts NICs into kernel, DPDK and VPP. A NIC is attributed to
VPP only when it appears in the stored port-assignment list — the bucket
records an assignment an operator made, not what VPP is driving. This box's
ports were never assigned through the console, so its two 40GbE NICs are
correctly shown as DPDK-bound (drv=vfio-pci) but never attributed to VPP,
while VPP forwards on them throughout this run.
The dataplane is unaffected, and this report is the evidence. The same box,
in the same run, onboarded 5,000 subscribers, moved 30 GB, held QoS on 480 of
480 subscribers and forwarded 13.57 Mpps. Onboarding, forwarding, QoS and the
session cap do not consult this list.
What does depend on it is a guard: the same stored list makes the devbind
bind / unbind / reset-to-kernel endpoints refuse an operation on a port VPP is
using. With the list empty that guard is not armed, so such a request is carried
out rather than refused — and it re-renders the dataplane configuration. Nothing
does this unprompted; it requires an operator or a script to ask.
Workaround: assign the dataplane ports on the Dataplane page during
commissioning, before the box carries subscribers. On a box already in service,
do not use those controls to correct the display — use a planned maintenance
window. Tracked as #49.
6.2 Four skipped checks
A skip is a precondition that was absent, not a pass. All four are expected:
| Check | Why it skipped |
|---|---|
test_throughput_recent_nonzero_under_load |
The aggregate throughput panel showed non-zero correctly, but the per-IP sampler has a known gap. Tracked as console #48. |
test_lockout_after_failures_then_admin_unlock |
The per-IP login rate limit (5 per 300 s) trips before the per-account lockout threshold can be reached from a shared source IP. The two protections are mutually exclusive from one address; the rate limit is the one that fired. |
test_a_captive_session_reports_its_lease |
Known gap, expected on a 1.4.0 controller — a captive session reports no usable lease stamp. Fixed for 1.5, tracked upstream as controller bng#48 — a different tracker from the console #48 above. Not a test limitation. |
test_upstream_dscp_remark_bits |
Not run — the skip reason is stale. The test carries xfail(run=False) with the reason "DSCP remark ACTION ships in the next major release". That stopped being true in 1.3.0: bng_access_input.c calls bng_mark_dscp() on both colours, and the codepoints are configurable per direction (green AF11 / yellow AF12 by default, marking off by default). The shipped feature therefore has no coverage in this run. Raised as a test defect; the marking behaviour itself was not exercised here either way. |
6.3 Scale limits worth stating
This is a 5,000-subscriber report and should not be read as a 25,000 one.
- Session reclamation at high scale. At 18,750 concurrent subscribers under
sustained churn, the controller's session view stops reclaiming released
sessions. Nothing is lost — orphans were zero in every run — but the count
stays at its high-water mark. Reproduced at 10,000; clean at 5,000 and
below, as this run shows (integrity 1.0, zero leaks). Traced upstream to two
defects, both fixed in controller 1.5. Tracked asbng#50. - The 25,000 cap is not validated by this run. The platform has been proven
to 18,750 concurrent sessions. The 25,000 figure is the licence grant's
ceiling, not a measured result. - Console polling scales with session count. Each console page re-fetches
the full session list on a timer, so controller load scales with
(tabs × pages × loops). At high session counts that request can be slow or
fail; 1.4.0 makes such a failure visible rather than rendering an empty table,
but retiring the full-list pull is#14. Prefer fewer simultaneously-open
console tabs during a scale test or maintenance window. - No forwarding ceiling is established in either direction by §5.6. The
policer carried 32.9 GB downstream and 30.7 GB upstream and classified every
byte, but those are the shaping workload's offered rates, not a search for a
limit. Forwarding limits are §5.7's subject, and there only 4 of 20 cells
found one. - Lease renewal under churn is not exercised (§5.5).
7. Artifact index
Every figure in this report is a screenshot of the harness's own rendering of
these files — not a chart drawn for the report.
| File | Size | Contents |
|---|---|---|
run-699-t.html |
482 KB | Full suite report, all 4,668 checks |
run-699-t.xml |
27 KB | JUnit XML |
run-699-cpe.json |
86 KB | DORA, traffic series, QoS per subscriber, policer colours |
run-699-coreperf.json |
104 KB | 24-cell forwarding matrix, per-thread counters |
run-699-dora-inrush.json |
122 KB | Cold and warm in-rush phases, comparison |
run-699-churn.json |
1,105 KB | Churn series, integrity, convergence, scatter |
run-699-aaa.json |
182 KB | Four local-AAA experiments with limited_by |
run-699-leasechurn.json |
1 KB | Cohort sizes, continuity samples |
run-699-unauth.json |
1 KB | Layered admission verdicts |
30 figures accompany this report. Each was verified non-blank by byte density
before publication (a blank capture is ~4 bytes per kilopixel; these range from
277 to 400).
8. Appendix — audit trail
Suite totals: 4,668 checks — 4,663 passed, 1 failed, 4 skipped, in 188.1
minutes.
Complete forwarding matrix with every limited_by, so §5.7 can be audited
rather than trusted:
The 20 UDP cells the matrix renders, as the panel classifies each:
| Workers | 64B | 128B | 512B | 1518B |
|---|---|---|---|---|
| 1 | BNG ceiling 6.78 | BNG ceiling 6.17 | line rate 4.23 | line rate 1.46 |
| 2 | BNG ceiling 13.57 | BNG ceiling 12.38 | line rate 4.23 | line rate 1.46 |
| 3 | floor (rss) 20.25 | line rate 15.20 | line rate 4.23 | line rate 1.46 |
| 4 | floor 21.93 | line rate 15.20 | line rate 4.23 | line rate 1.46 |
| 5 | floor 21.93 | line rate 15.20 | line rate 4.23 | line rate 1.46 |
Totals: 4 ceiling, 13 line rate zero-loss, 3 floor — matching the panel's own
summary. Four TCP-profile cells exist in the JSON but are not part of the matrix
and are not used here.
Four cells of twenty are maximum-throughput numbers. They are the four quoted in
§5.7, and no other forwarding figure in this report is presented as a platform
capability.
Three-run comparison on identical parameters and hardware, used in §3.1 to
assess core isolation:
| Cell | Run 696 (no isolcpus) |
Run 698 (isolcpus) |
Run 699 (isolcpus) |
|---|---|---|---|
| 1 worker, 64B | 7.04 Mpps | 6.779 | 6.776 |
| 1 worker, 128B | 6.328 Mpps | 6.156 | 6.167 |
| 2 workers, 64B | 13.68 Mpps | 13.59 | 13.57 |
| 2 workers, 128B | 12.25 Mpps | 12.31 | 12.38 |
Build provenance: bundle 1.4.0-13, plugin 0.10.36, commit 9a12835,
clean working tree. Pre-flight gate passed all twelve checks before launch.