
QuantumBNG Grafana Dashboard Pack
Five ready-made Grafana dashboards for a QuantumTouch BNG. This guide covers
installing the pack, connecting Grafana to the BNG's metrics, importing the
dashboards, and reading the handful of panels that are easy to misinterpret.
The pack is free. There is no licence, no key to request, and no charge —
now or later. Install it on as many boxes and point as many Grafana instances
at it as you like.
What you need
- A QuantumTouch BNG running v1.3.0-13 or later, reachable on
:8443.
(1.4.0 ships v1.4.0-14; the pack itself is unchanged since 1.3.1.) - Grafana 10 or 11, anywhere that can reach the BNG. Grafana Cloud, a
container on your laptop, or your existing estate Grafana all work. - An administrator login on the BNG console.
Nothing is installed into Grafana beyond the dashboards themselves: no plugins,
no custom panels, no datasource UID baked into the JSON.
What you get
| Dashboard | Panels | What it answers |
|---|---|---|
| Overview | 14 | Are subscribers connecting, is traffic flowing, which QoS band is it landing in, is the reply path alive |
| Interfaces & Dataplane | 9 | Per-interface throughput and packet rates, VPP worker load |
| Access & Security | 18 | Who can log in, which API keys exist and when they expire, TLS certificate lifetime |
| Chassis & Power | 16 | IPMI sensors, thermal headroom, power feeds — physical hardware only |
| Platform Health | 19 | Webhook delivery queue, audit spool, metric baselines |
That is 76 panels across the five. Every dashboard is tagged quantumtouch
plus one area tag, so a single tag: quantumtouch filter in Grafana finds the
whole set.
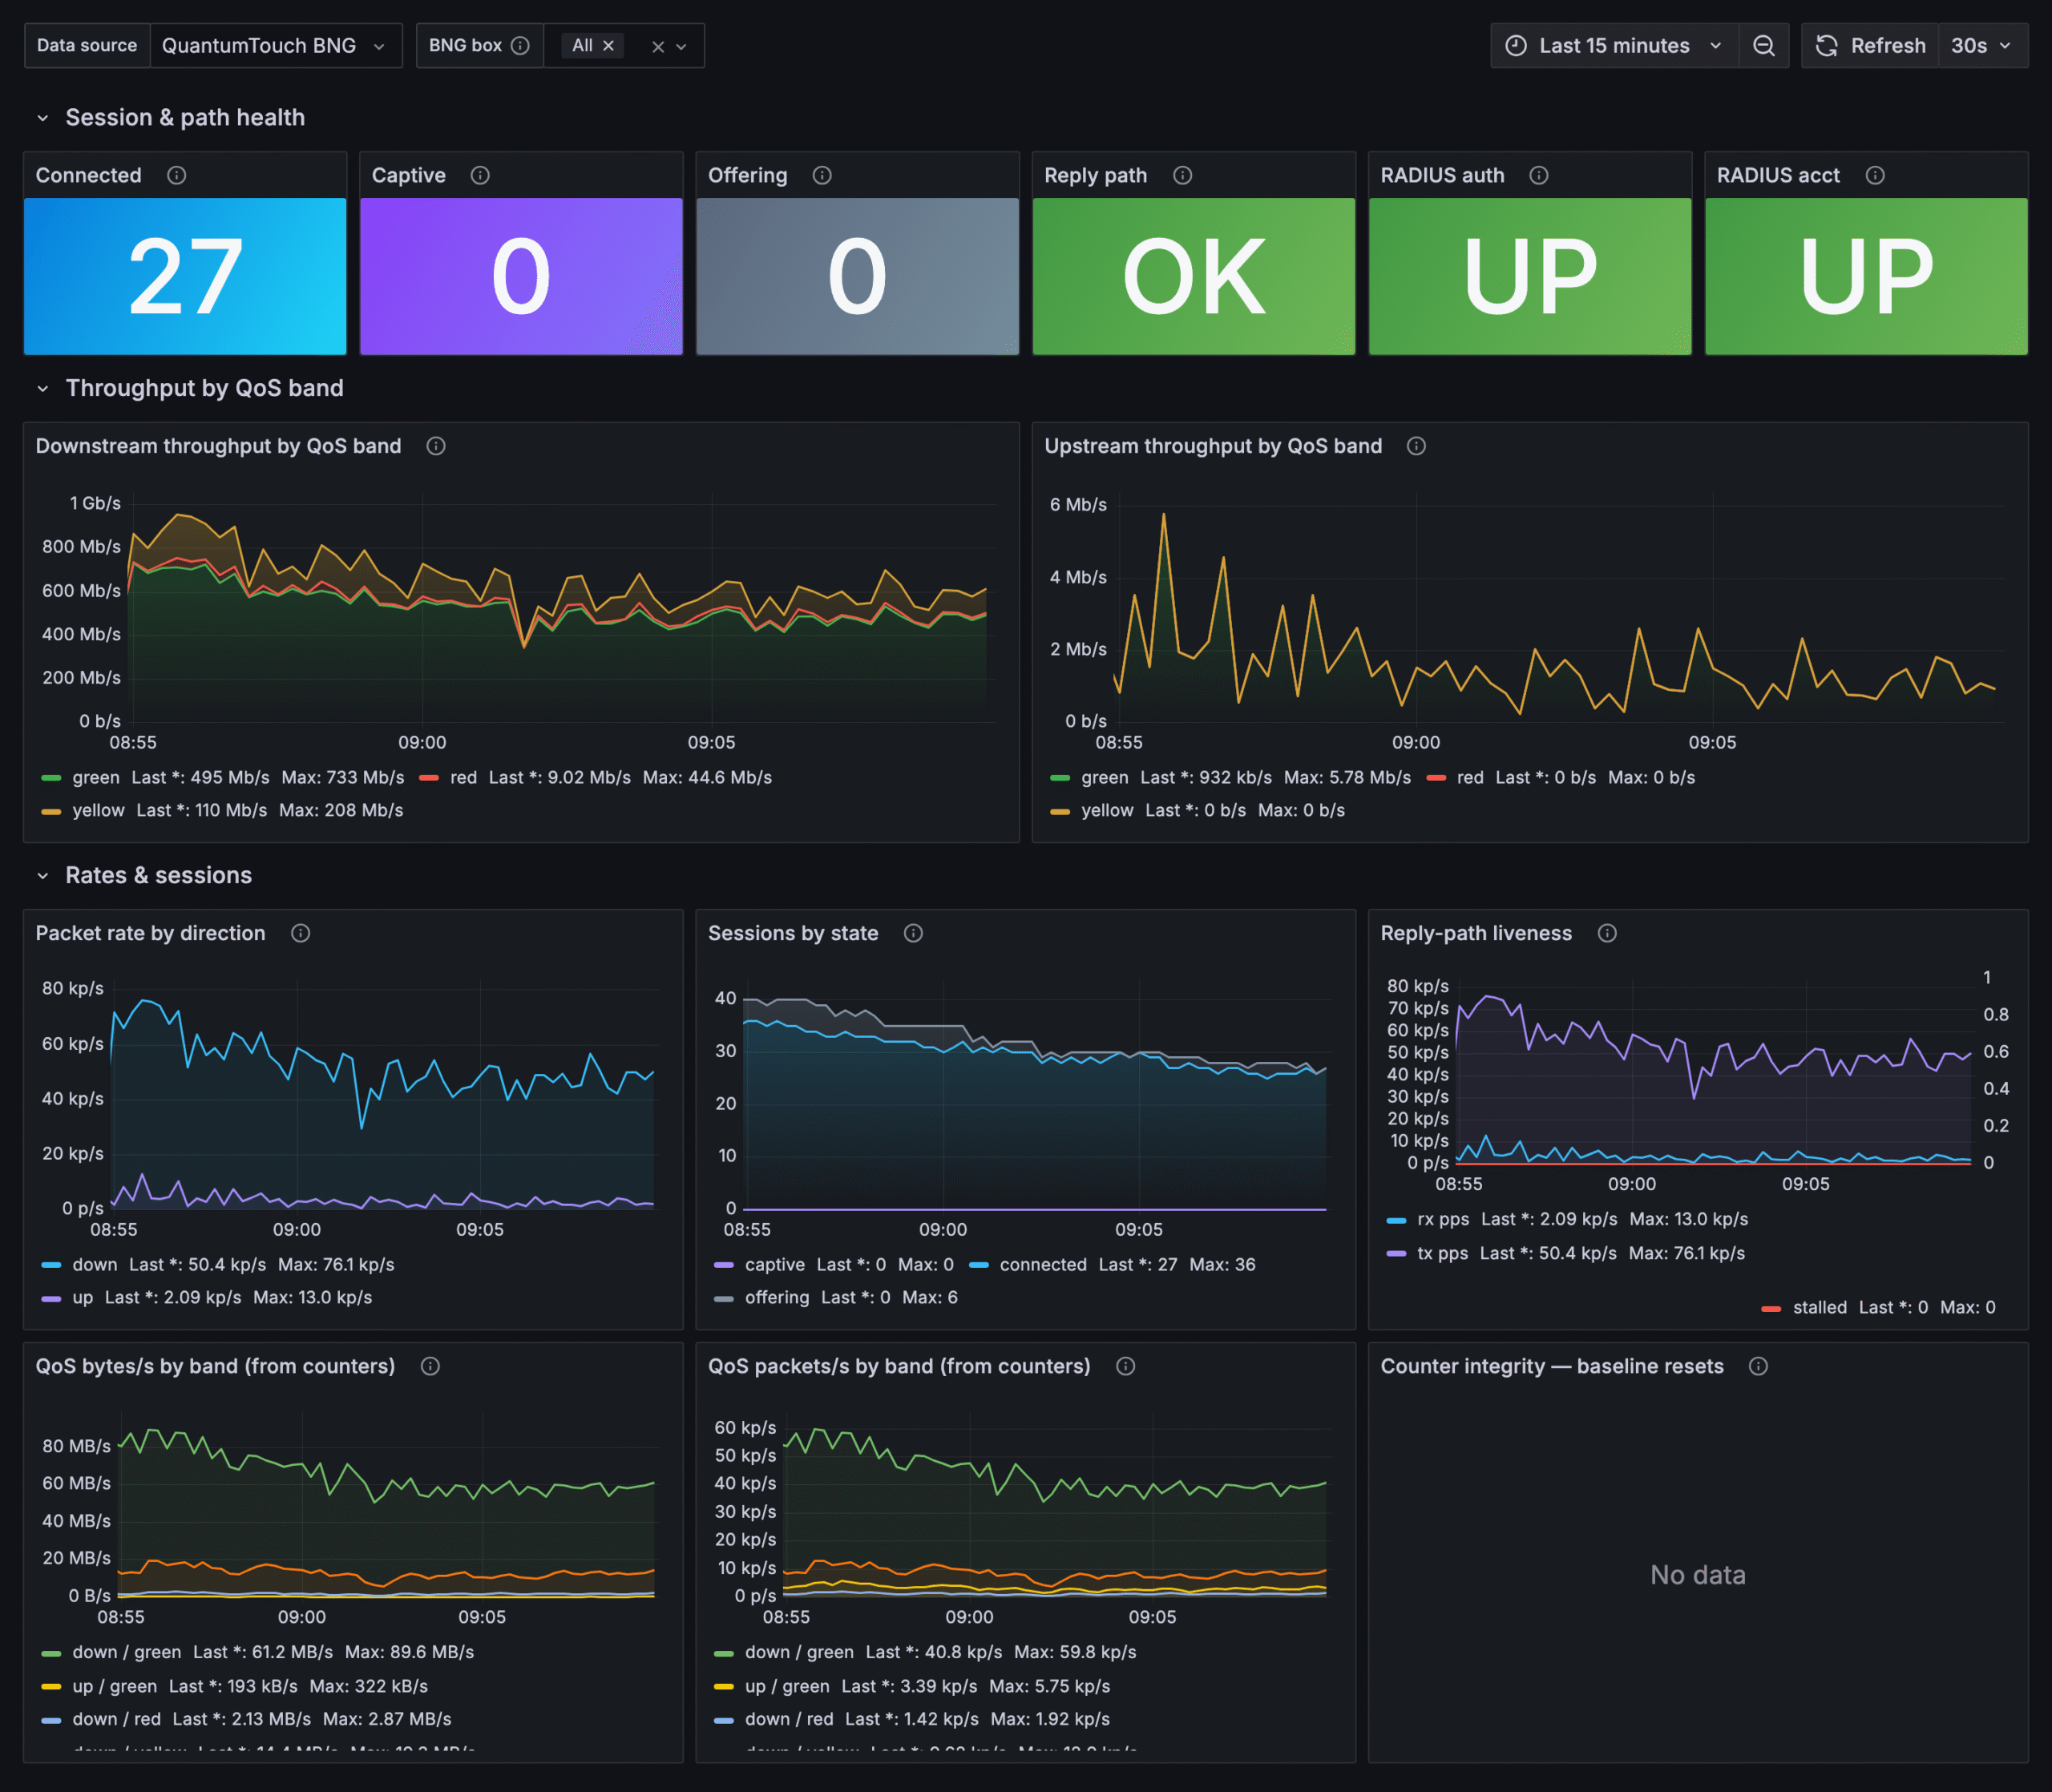
Overview, on an evaluation appliance running 30 simulated subscribers. The two
throughput panels are the tri-band QoS meter: green inside the committed rate,
yellow in the burst band, red over the ceiling.
Step 1 — Install the pack on the BNG
The pack is a Toybox plugin. Installing it stages dashboard files on the box
as data — nothing runs, no service is created, no script executes. The BNG
then serves those files back out over its own authenticated API, which is what
lets an air-gapped Grafana get the dashboards without any internet access of
its own.
In the console, go to About → Toybox, find Grafana dashboard pack, and
click Install.
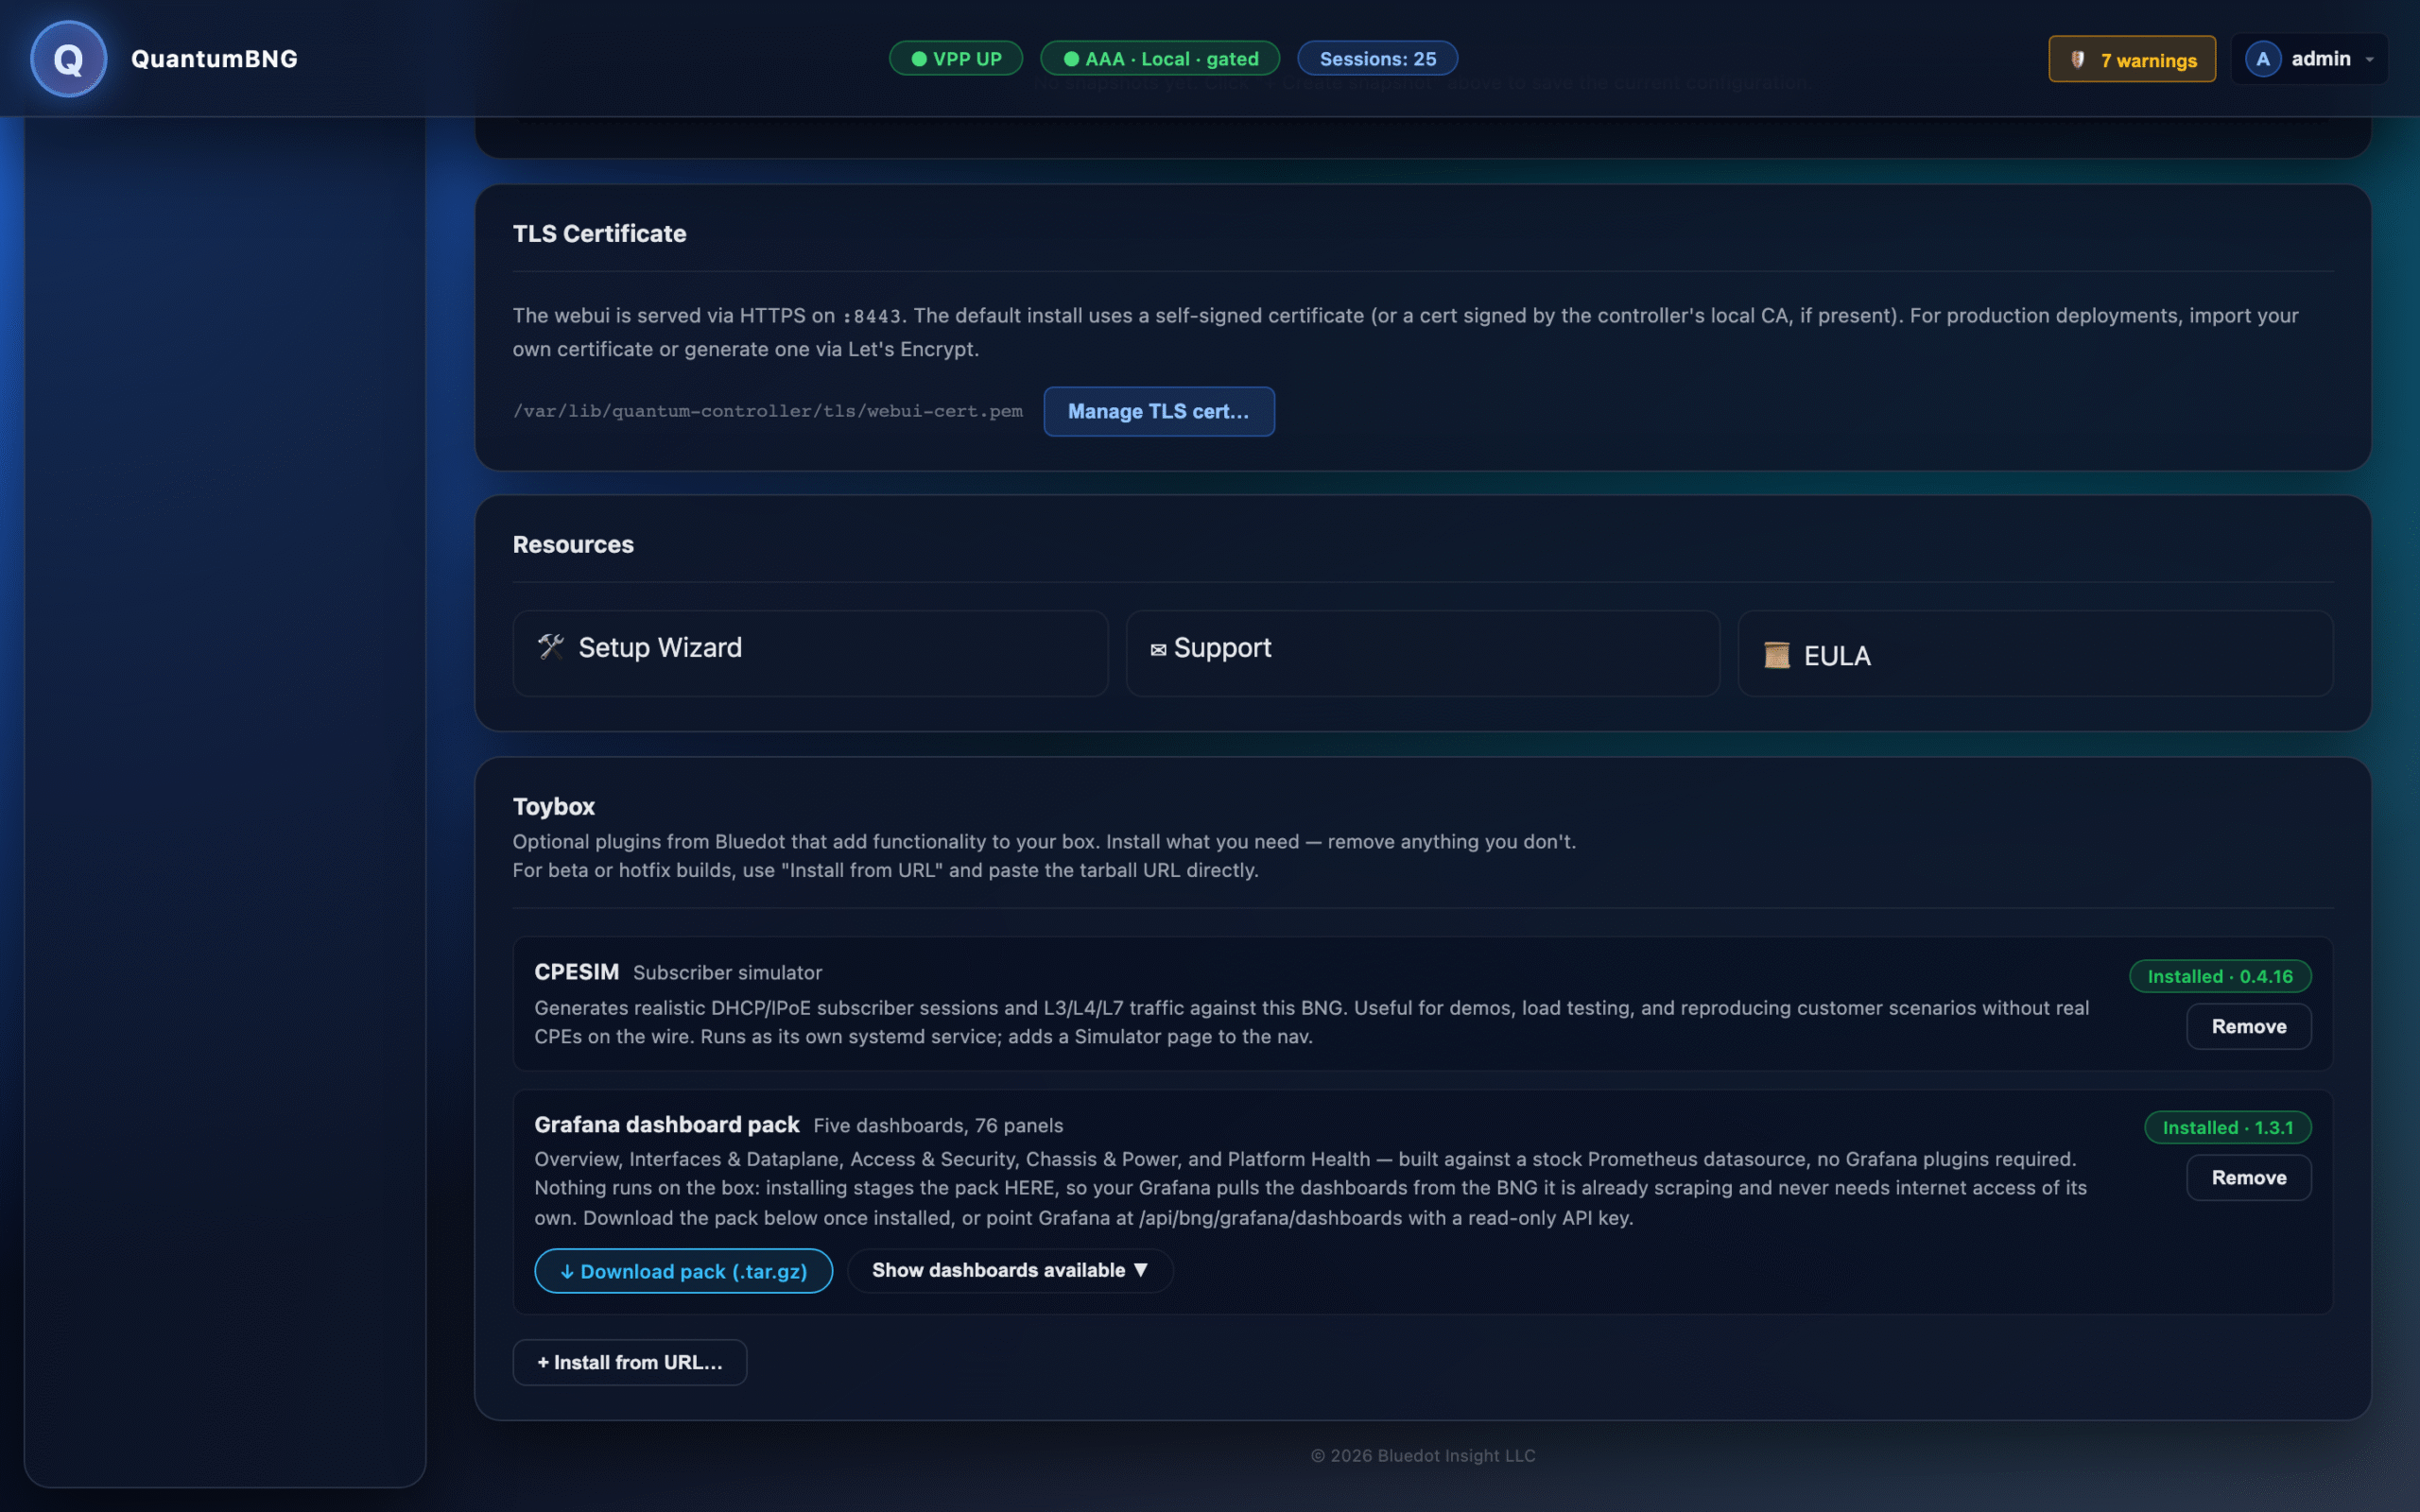
The box downloads the current pack, verifies it against its published SHA-256
checksum before extracting anything, and stages it. A tarball whose bytes do
not match is refused outright and the box is left exactly as it was.
If the BNG has no outbound internet access, mirror the pack instead.
On a machine that does have access, download both
bng-grafana-pack.tar.gzandbng-grafana-pack.tar.gz.sha256from
the pack release page, host them anywhere the BNG can reach over
HTTP(S) keeping their names side by side — the checksum URL is derived by
appending.sha256to the tarball URL — then use Toybox's Install from
URL with your mirrored tarball URL. The same checksum verification applies.
Step 2 — Create an API key for Grafana
Grafana authenticates to the BNG with an API key. Give the integration its own
key rather than reusing a person's.
Go to System → API Keys → Create key and choose the
"Grafana / metrics only" preset. It sets the role to read_only and
restricts the key to the metrics path, so it cannot be widened by mistake.
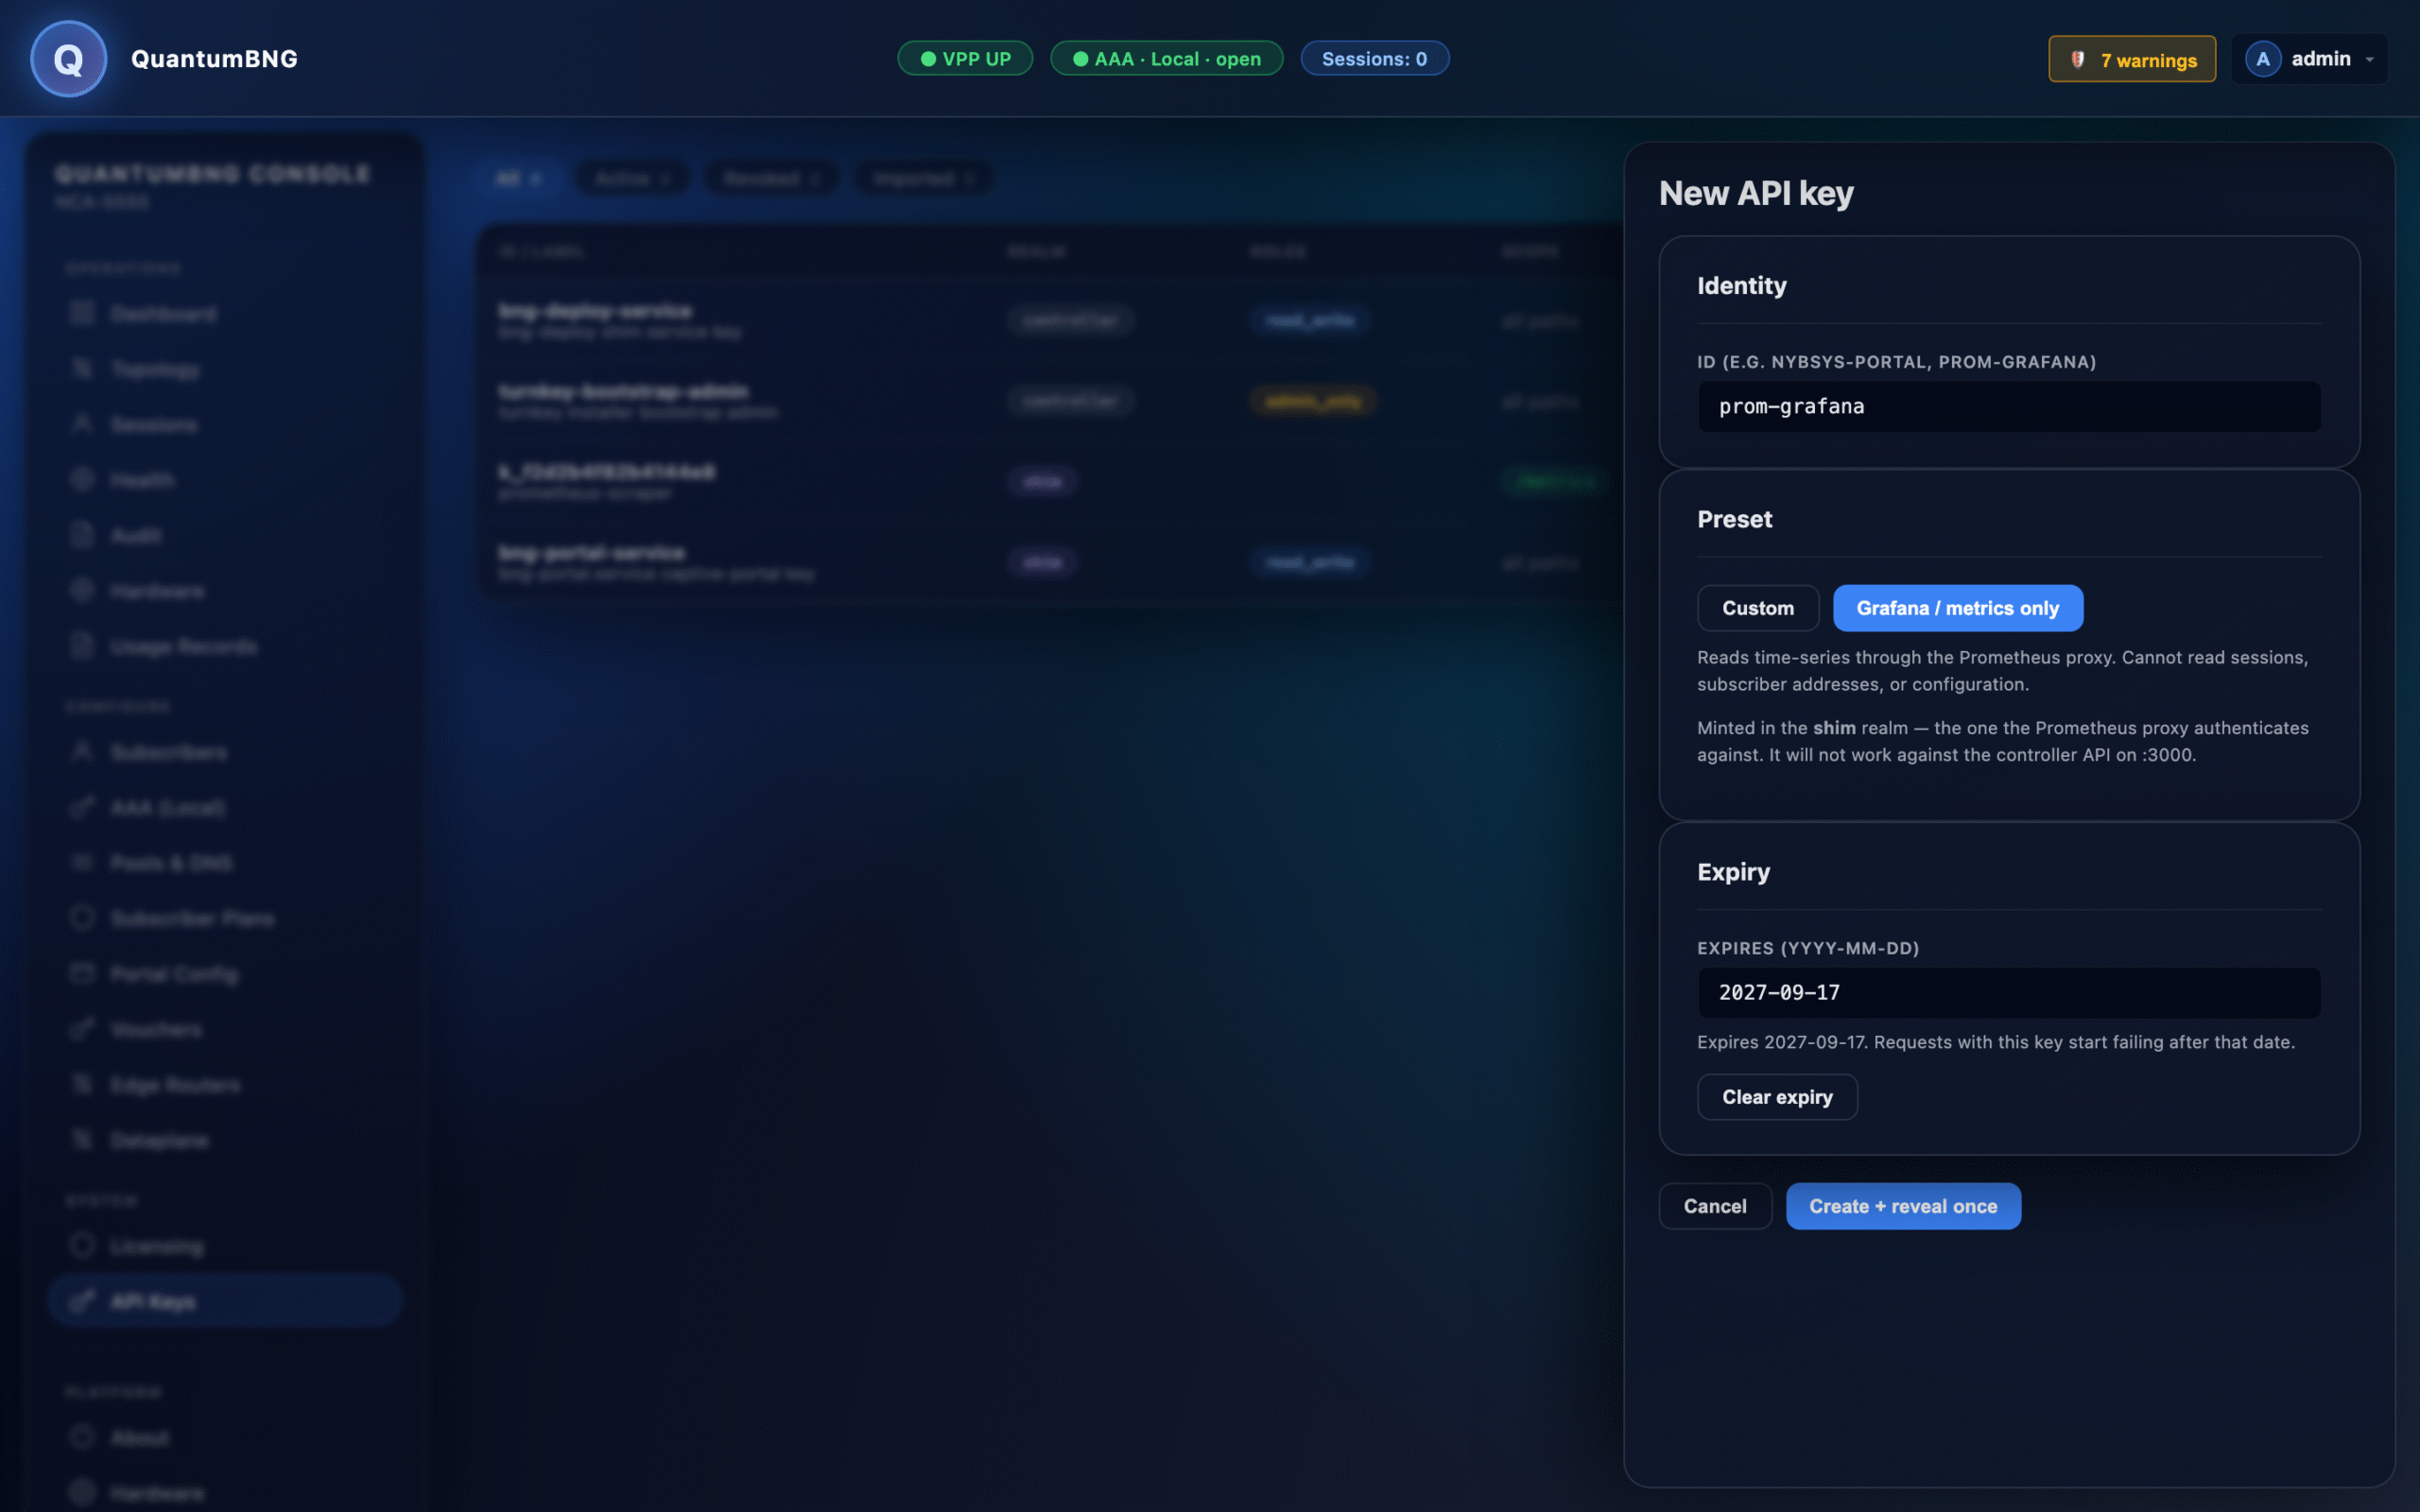
Click Create + reveal once and copy the token immediately. It is shown
exactly once — only its SHA-256 hash is stored, so a lost token cannot be
recovered, only replaced.
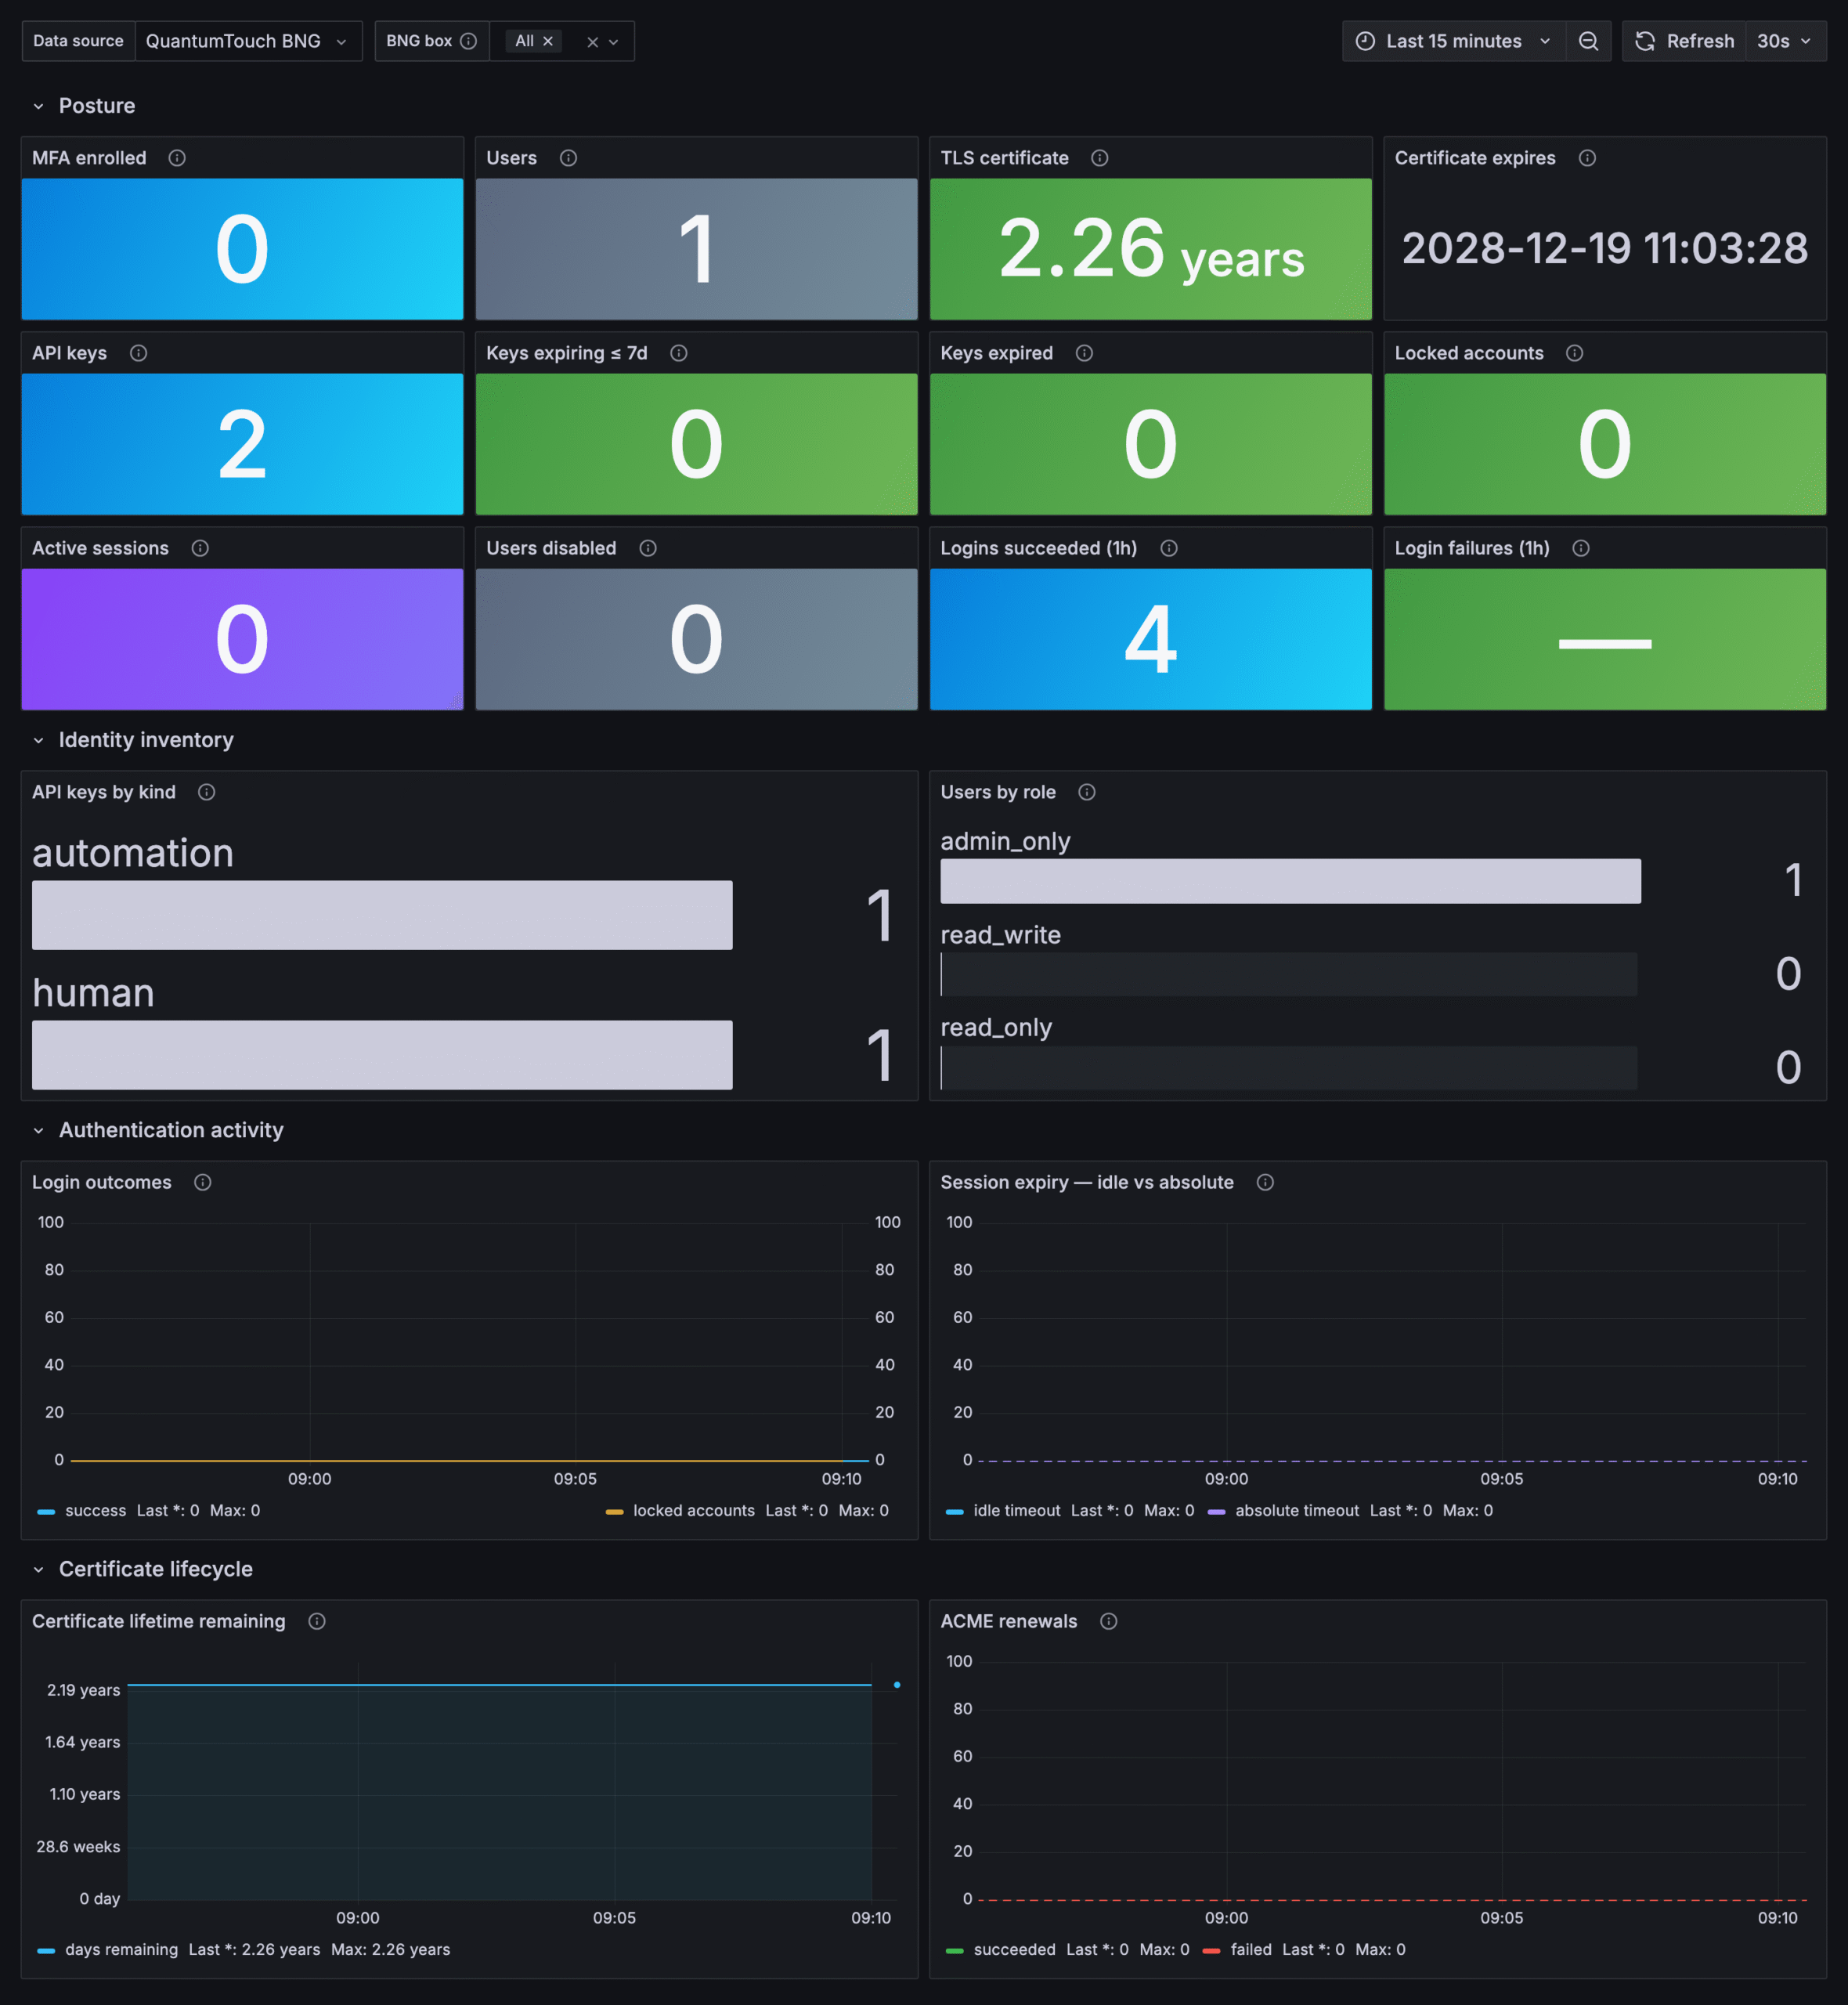
Set an expiry you will actually see coming. The preset defaults to 365
days. When an API key expires, every dashboard in this pack goes blank at the
same moment, and that presents as a broken BNG rather than an expired
credential. The Access & Security dashboard carries a Keys expiring ≤ 7d
tile for exactly this — put it somewhere you look.
If you also want Grafana to pull the dashboards from the box
The "Grafana / metrics only" preset scopes the key to /api/bng/prometheus/*.
That is all the datasource needs, and if you import the dashboard files by hand
(Step 4) it is all you need at all.
The BNG also serves the staged dashboards over /api/bng/grafana/*, and a
preset-scoped key is refused with 403 on those routes — the role is right,
the path scope is not. If you want to fetch dashboards from the box, add
/api/bng/grafana/* to the key's path scope when you create it. Both routes
need only the read_only role.
| Route | Returns |
|---|---|
GET /api/bng/grafana/dashboards |
the staged dashboards, with uid, title and filename |
GET /api/bng/grafana/dashboards/<uid> |
one dashboard's JSON, byte-identical to what shipped |
GET /api/bng/grafana/pack.tar.gz |
the whole verified pack, as the original tarball |
Step 3 — Add the BNG as a Prometheus datasource
Prometheus runs on the BNG, bound to 127.0.0.1:9090, and is deliberately
not reachable from your network. The way in is an authenticated read-only proxy
on the console port. It speaks native Prometheus — same JSON, same status
codes — so a stock Prometheus datasource works against it unmodified.
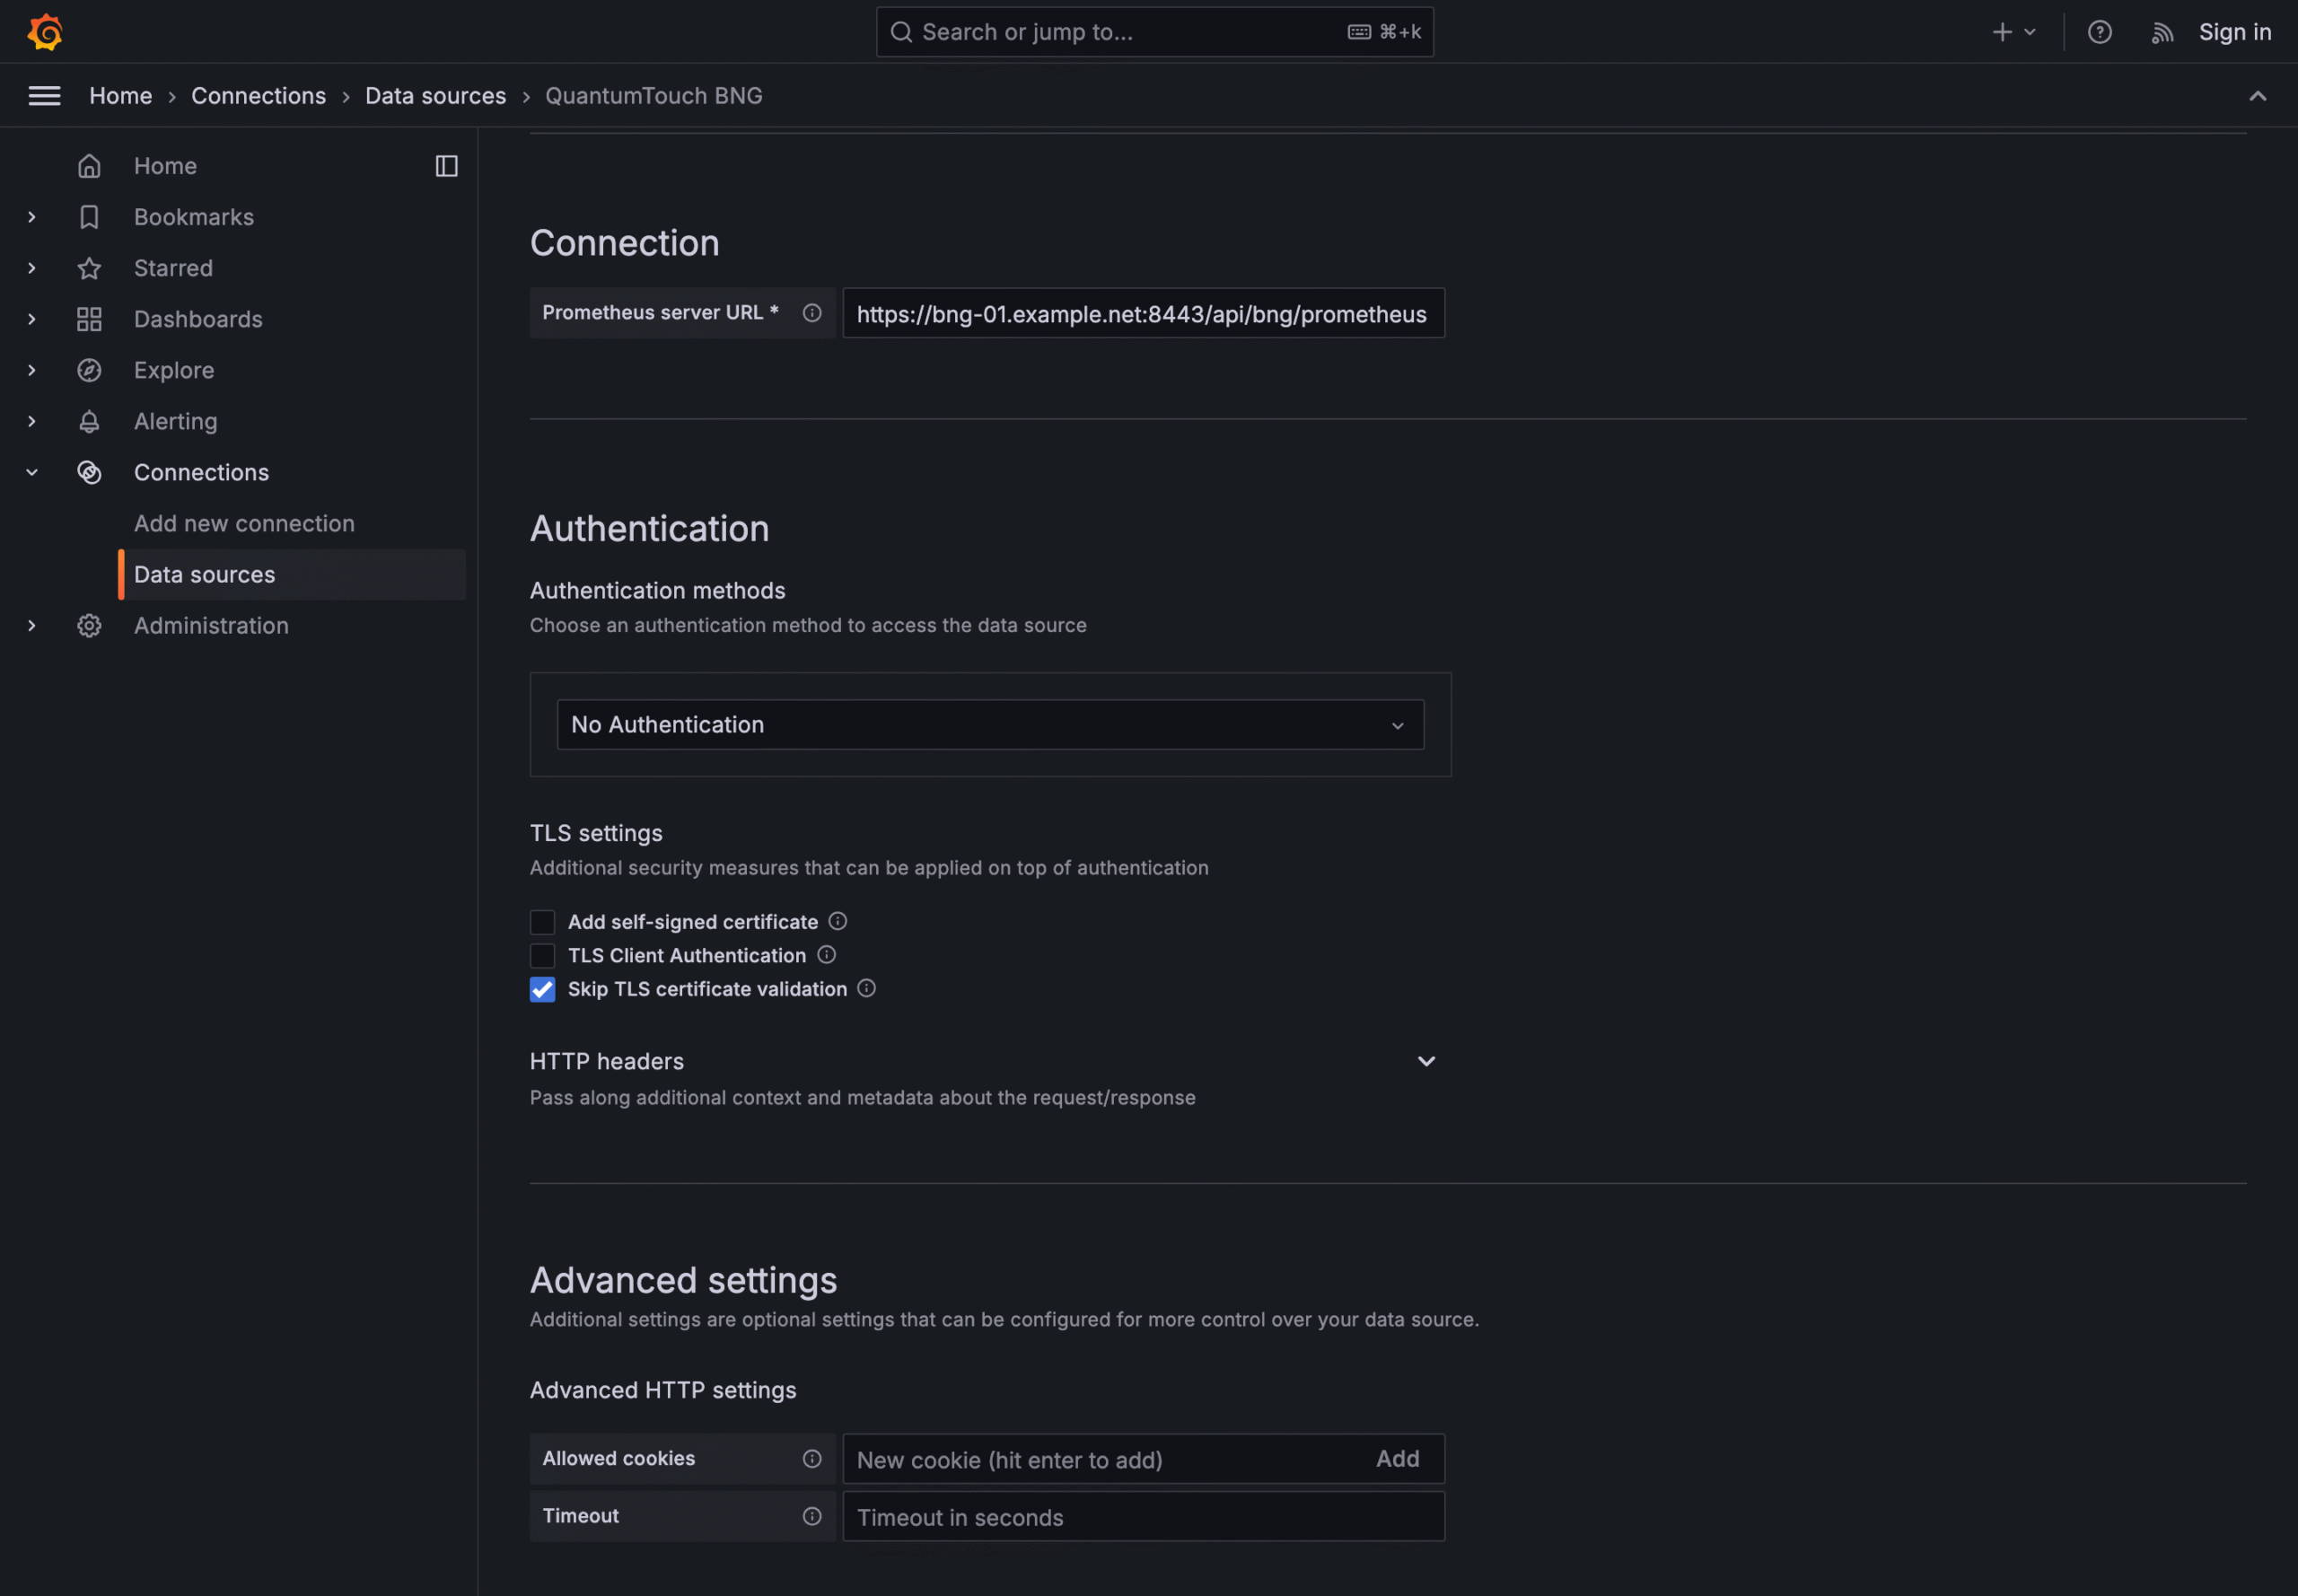
In Grafana: Connections → Data sources → Add new → Prometheus.
| Field | Value |
|---|---|
| URL | https://<bng-host>:8443/api/bng/prometheus |
| HTTP method | POST |
| Custom HTTP header — name | Authorization |
| Custom HTTP header — value | Bearer <your token> |
Paste only that base URL. Grafana appends its own suffixes (/api/v1/query_range
and so on) when it queries.
TLS
By default the BNG serves a certificate that is self-signed or signed by the
box's own private CA, so Grafana will refuse the connection until you deal with
it. Two options:
- Install the BNG's certificate into Grafana's trust store. The right
choice whenever Grafana reaches the box over a routable network. With
verification on, Grafana can tell if something other than the BNG answers on
that address. Without it, it cannot — and the Bearer token above is exactly
what an interposer would collect. - Enable "Skip TLS certificate verification." Acceptable only on a link you
trust end to end, such as Grafana and the BNG on the same isolated management
network. Do not make this the default on a shared network.
If your BNG was installed with your own certificate (QT_CUSTOMER_CERT /
QT_CUSTOMER_KEY) and that certificate already chains to a CA Grafana trusts,
neither applies — it just works, and you should not disable verification.
Click Save & test. Grafana calls /api/v1/status/buildinfo, which the proxy
allows; a healthy datasource reports "Successfully queried the Prometheus API."
Step 4 — Import the dashboards
From the Grafana UI — Dashboards → New → Import → Upload JSON file, one
file at a time. Each import asks which Prometheus datasource to use; the pack
deliberately bakes in no datasource UID, which is what makes that prompt appear.
You can take the JSON from the pack tarball, or straight off the box with the
key from Step 2:
curl -H "Authorization: Bearer <token>"
     https://<bng-host>:8443/api/bng/grafana/dashboards
By provisioning, if you automate Grafana: copy the pack onto the Grafana
host and place the two files from provisioning/ into Grafana's provisioning
tree. Read the comments in them first — the datasource file needs your BNG host
and token, and the dashboard file needs the path you copied dashboards/ to.
/etc/grafana/provisioning/datasources/quantumtouch-bng.yaml
/etc/grafana/provisioning/dashboards/quantumtouch-bng.yaml
Step 5 — Set the dashboard variables
Every dashboard has Data source and BNG box. Two dashboards add more.
BNG box — leave it on All, and expect it to be empty
If you have one Grafana reading one BNG, the dropdown will be empty and that
is correct. BNG metrics carry plane and box as Prometheus external
labels, which are attached when Prometheus sends data onward — federation,
remote write, alerting — and are never written into its own local storage. A
Prometheus scraping a single BNG therefore has no box label on any series.
All interpolates to "match everything", so every panel works regardless.
Federate several BNGs into one Prometheus and the dropdown fills in by itself,
and you can then switch between boxes on the same dashboards.
Access interface / Uplink interface — set these once, then save
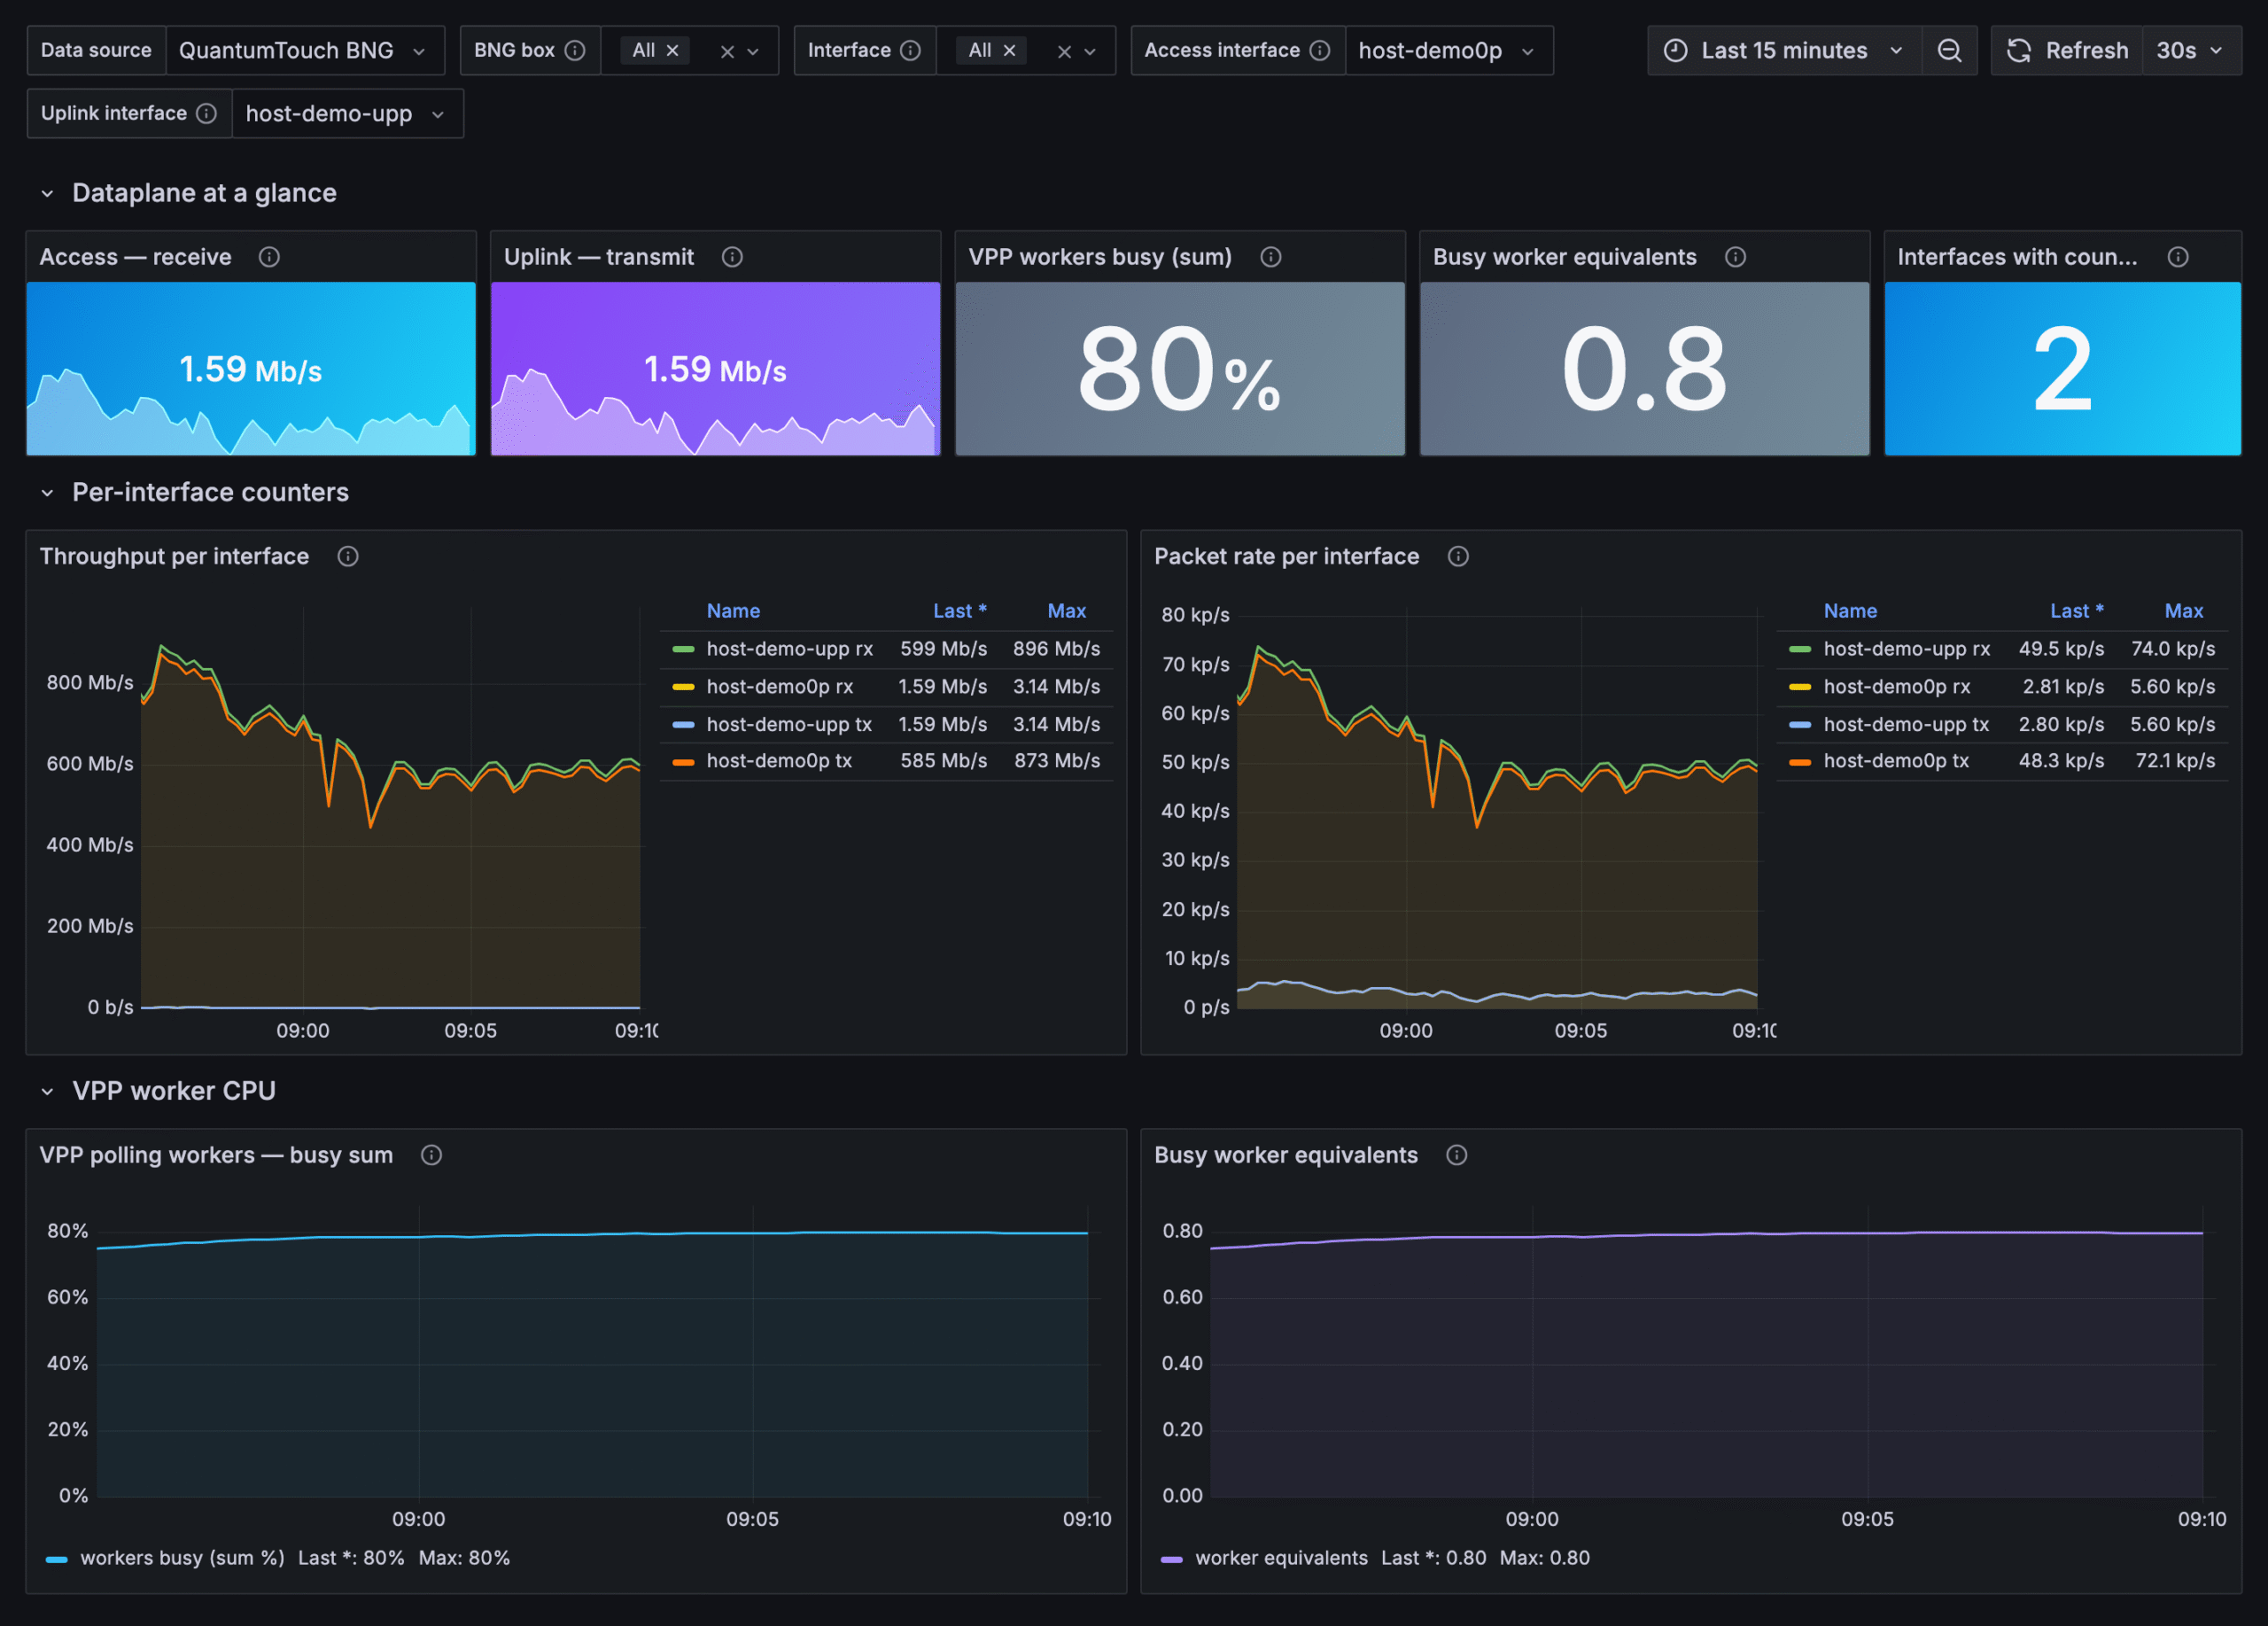
On the Interfaces & Dataplane dashboard these default to the reference box's
port names and will not match yours. Pick your real interfaces from the
dropdowns and save the dashboard.
Which port faces subscribers and which faces the network is a fact about your
deployment, so the dashboard asks rather than guessing. Only the two summary
tiles at the top use these; the graphs below plot every interface and need no
configuration.
Interface, Temperature sensor
Multi-select filters, default to all. Nothing to configure.
Reading the dashboards
Three panels are routinely misread. None of them indicates a fault.
VPP worker CPU is a sum, not a percentage of the box. VPP workers busy adds
up each polling worker's busy percentage. VPP's workers spin at ~100% by design
whether or not traffic is flowing, so a box with five workers reads about 500%
when idle. It is not 500% of a core and nothing is wrong. The Busy worker
equivalents tile divides by 100 to give a figure you can compare against your
worker count — the screenshot above shows 79% and 0.8 on a single-worker
evaluation appliance.
Thermal headroom is a ratio, not a temperature. Each sensor is divided by
the warning threshold the BMC declares for that sensor, so 100% means "at its
own limit". Ranking by raw temperature would mislead: CPUs typically warn at
80 °C and DIMMs at 65 °C on the same board, so a CPU at 59 °C and a DIMM at
46 °C are 74% and 71% — nearly tied on headroom while looking 13 °C apart on a
thermometer.
Discrete IPMI sensors carry no health verdict. These are raw state bitfields
from the BMC, and the masks are model-specific, so there is deliberately no
ok/not-ok series for them — an earlier build reported "not ok" for all of them
on a perfectly healthy chassis. Compare a sensor against itself over time, which
is what the state-change panel does. Do not add a threshold to that table.
Panels that are empty on purpose
Empty is not broken.
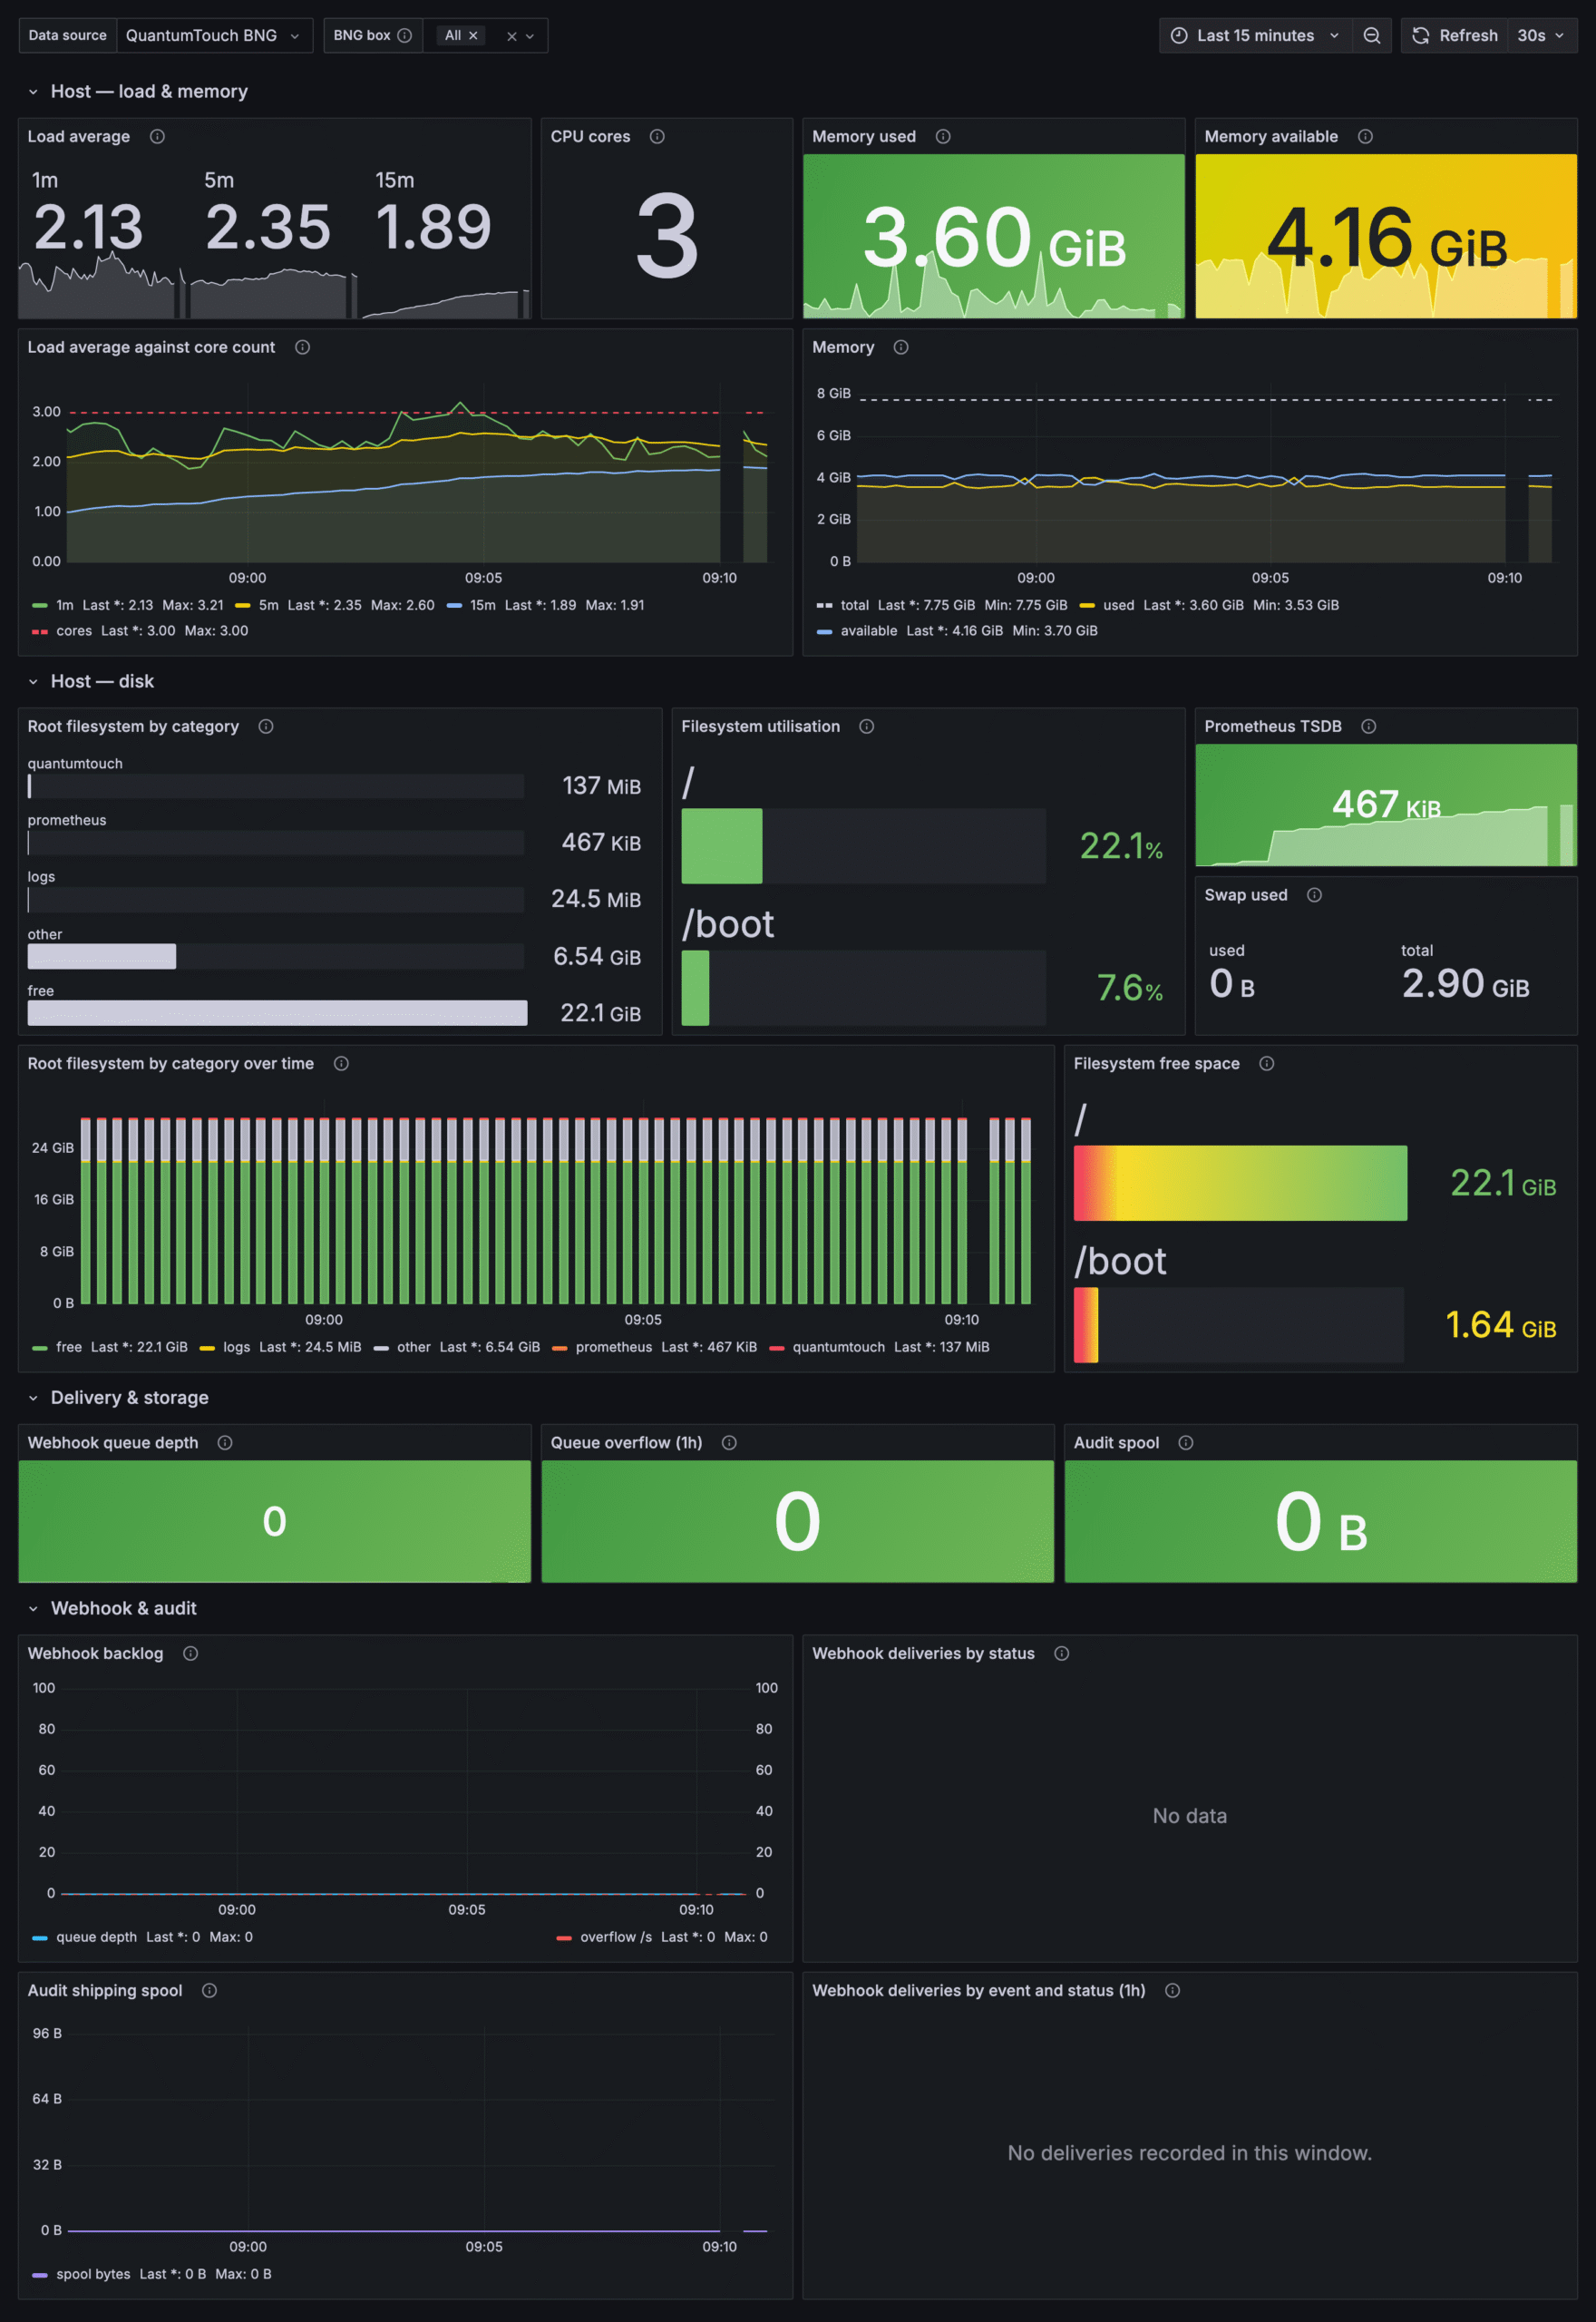
Anything on Chassis & Power, without a BMC. The evaluation appliance is a
virtual machine with no IPMI, so the whole dashboard reads DOWN / No data.
That is the correct result, not a failed install. On physical hardware whose BMC
is reachable only over the network rather than in-band, these series can also
stay empty while the console's own hardware page works.
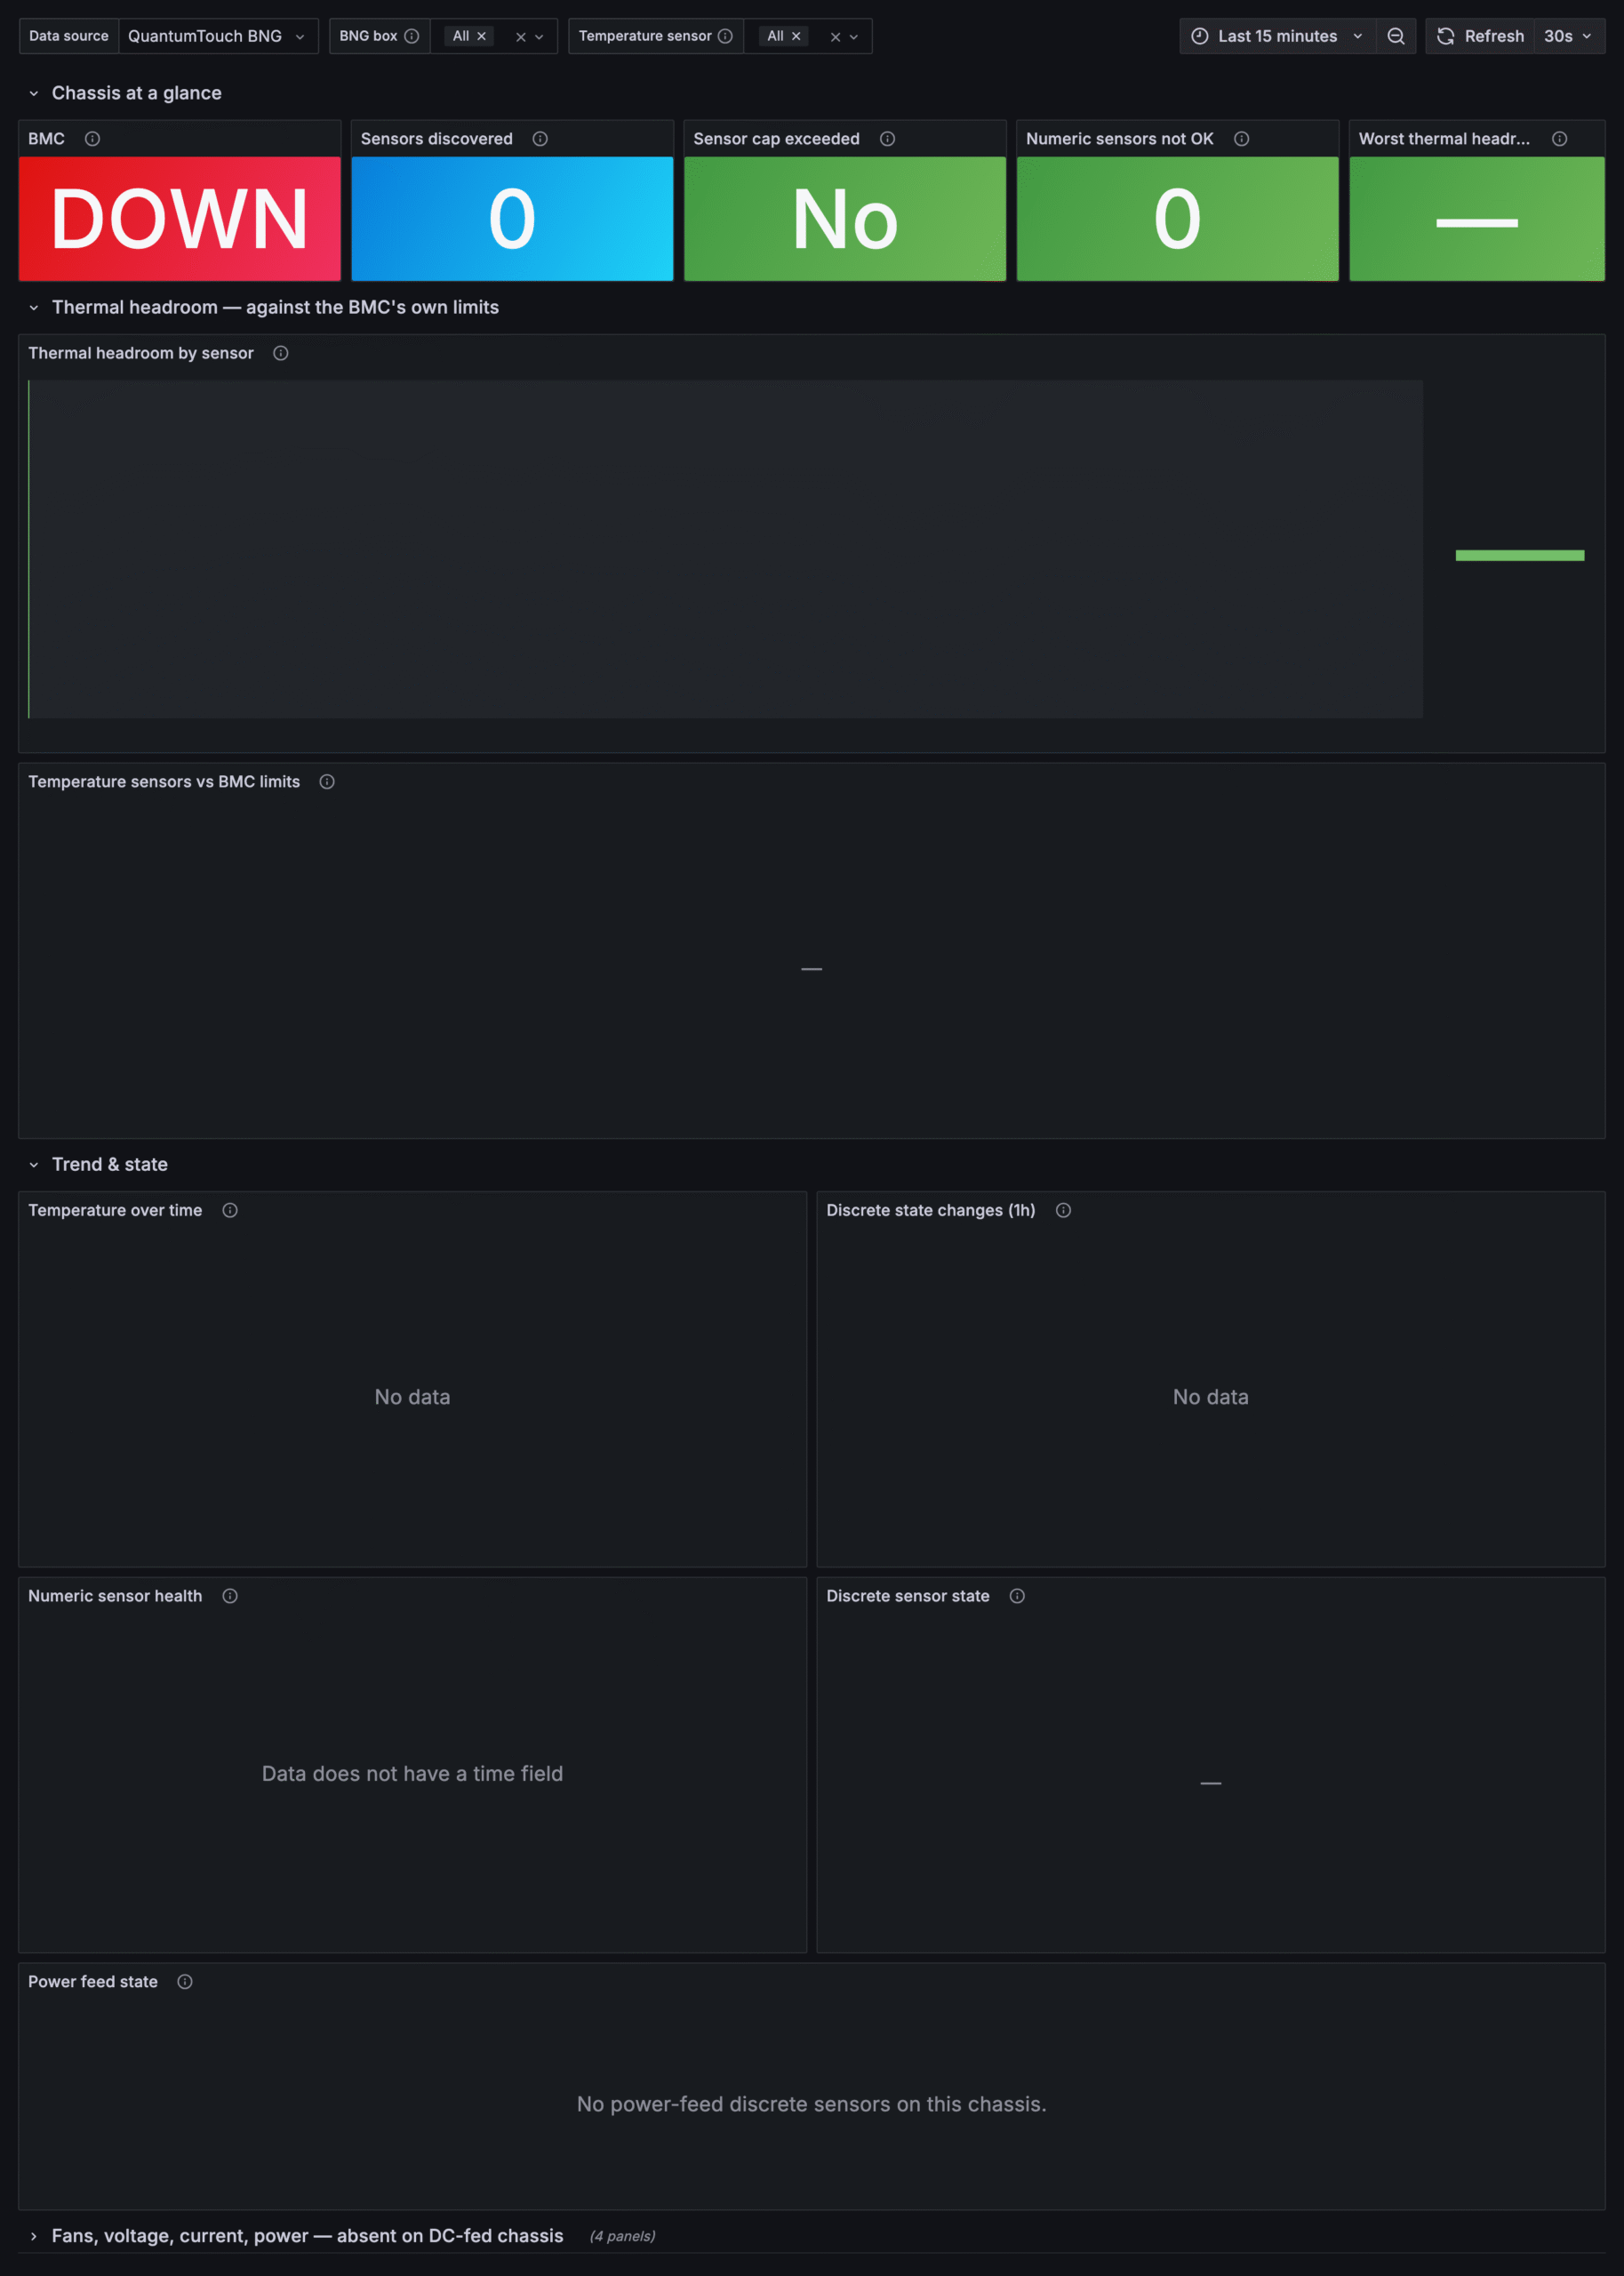
Fans, voltage, current and power, on a DC-fed chassis with no PSU
sub-sensors. That row ships collapsed so a chassis without them shows nothing
rather than four empty axes, and expands into real graphs on a chassis that has
them.
Any labelled counter before its first increment. QoS, webhook and login
counters have no series at all until something increments them. A quiet box
shows nothing here; a busy one fills in within a scrape or two.
Retention
The BNG keeps 30 days of metrics or 5 GB, whichever comes first. A panel
asking for a longer range renders a partial series for the time still retained,
rather than an error. If you need longer history, federate the BNG into a
Prometheus of your own with the retention you want — the same datasource and the
same dashboards work against it.
Troubleshooting
| What you see | What it means |
|---|---|
| Datasource test fails on TLS | The BNG's certificate is not trusted by Grafana — see TLS in Step 3. |
401 from every panel |
The token is wrong, or missing its Bearer prefix in the header value. |
403 on /api/bng/grafana/* but metrics work |
The key is scoped to the metrics path only. Add /api/bng/grafana/* to its path scope — see Step 2. |
| Everything blank, all at once, having worked before | The API key expired. Check Keys expiring ≤ 7d on Access & Security. |
BNG box dropdown is empty |
Correct for a single BNG — see Step 5. |
| Two tiles on Interfaces read zero, graphs are fine | Access interface / Uplink interface still point at the reference box. See Step 5. |
| A panel is empty | Check Panels that are empty on purpose above before raising a ticket. |
If you need help, the Audit page records the Toybox install and every
console action around it, and is the first thing to send to support.