
5. Results
5.1 Subscriber onboarding — run-699-cpe.json
What it measures. Every simulated CPE performs a real DHCP DORA exchange
through the relay. The check is how many reach a bound session, and how fast.
Why it matters. This is the operation an ISP performs most: a subscriber
powering on. A platform that onboards slowly recovers slowly from an outage.
| Target / bound | 5,000 / 5,000 |
| Success rate | 100% |
| Rate | 398.7 bound per second |
| Elapsed | 12.54 s |
| DORA latency p50 | 1,389 ms |
| DORA latency p95 | 9,279 ms |
| Minimum / maximum | 211.7 ms / 10,514 ms |
| Retransmits | 1,469 |
Read the latency figures as queueing delay, not service time. The whole
fleet is launched at once, so a subscriber's measured DORA time includes waiting
behind the rest of the storm. The p50 of 1.4 s does not mean a single
subscriber waits 1.4 s on an idle box — the minimum of 211 ms is closer to that.
The 1,469 retransmits are the DHCP protocol doing its job under a burst; no
subscriber was lost.
5.2 In-rush, cold versus warm — run-699-dora-inrush.json
What it measures. A 900/s requested storm against a cold box, then the same
storm again once caches and sessions are warm.
Why it matters. It separates steady-state capability from first-contact
behaviour — the difference between a planned migration and a recovery.
| Phase | Completion rate | limited_by |
|---|---|---|
| Cold | 391.8/s | none |
| Warm | 405.5/s | none |
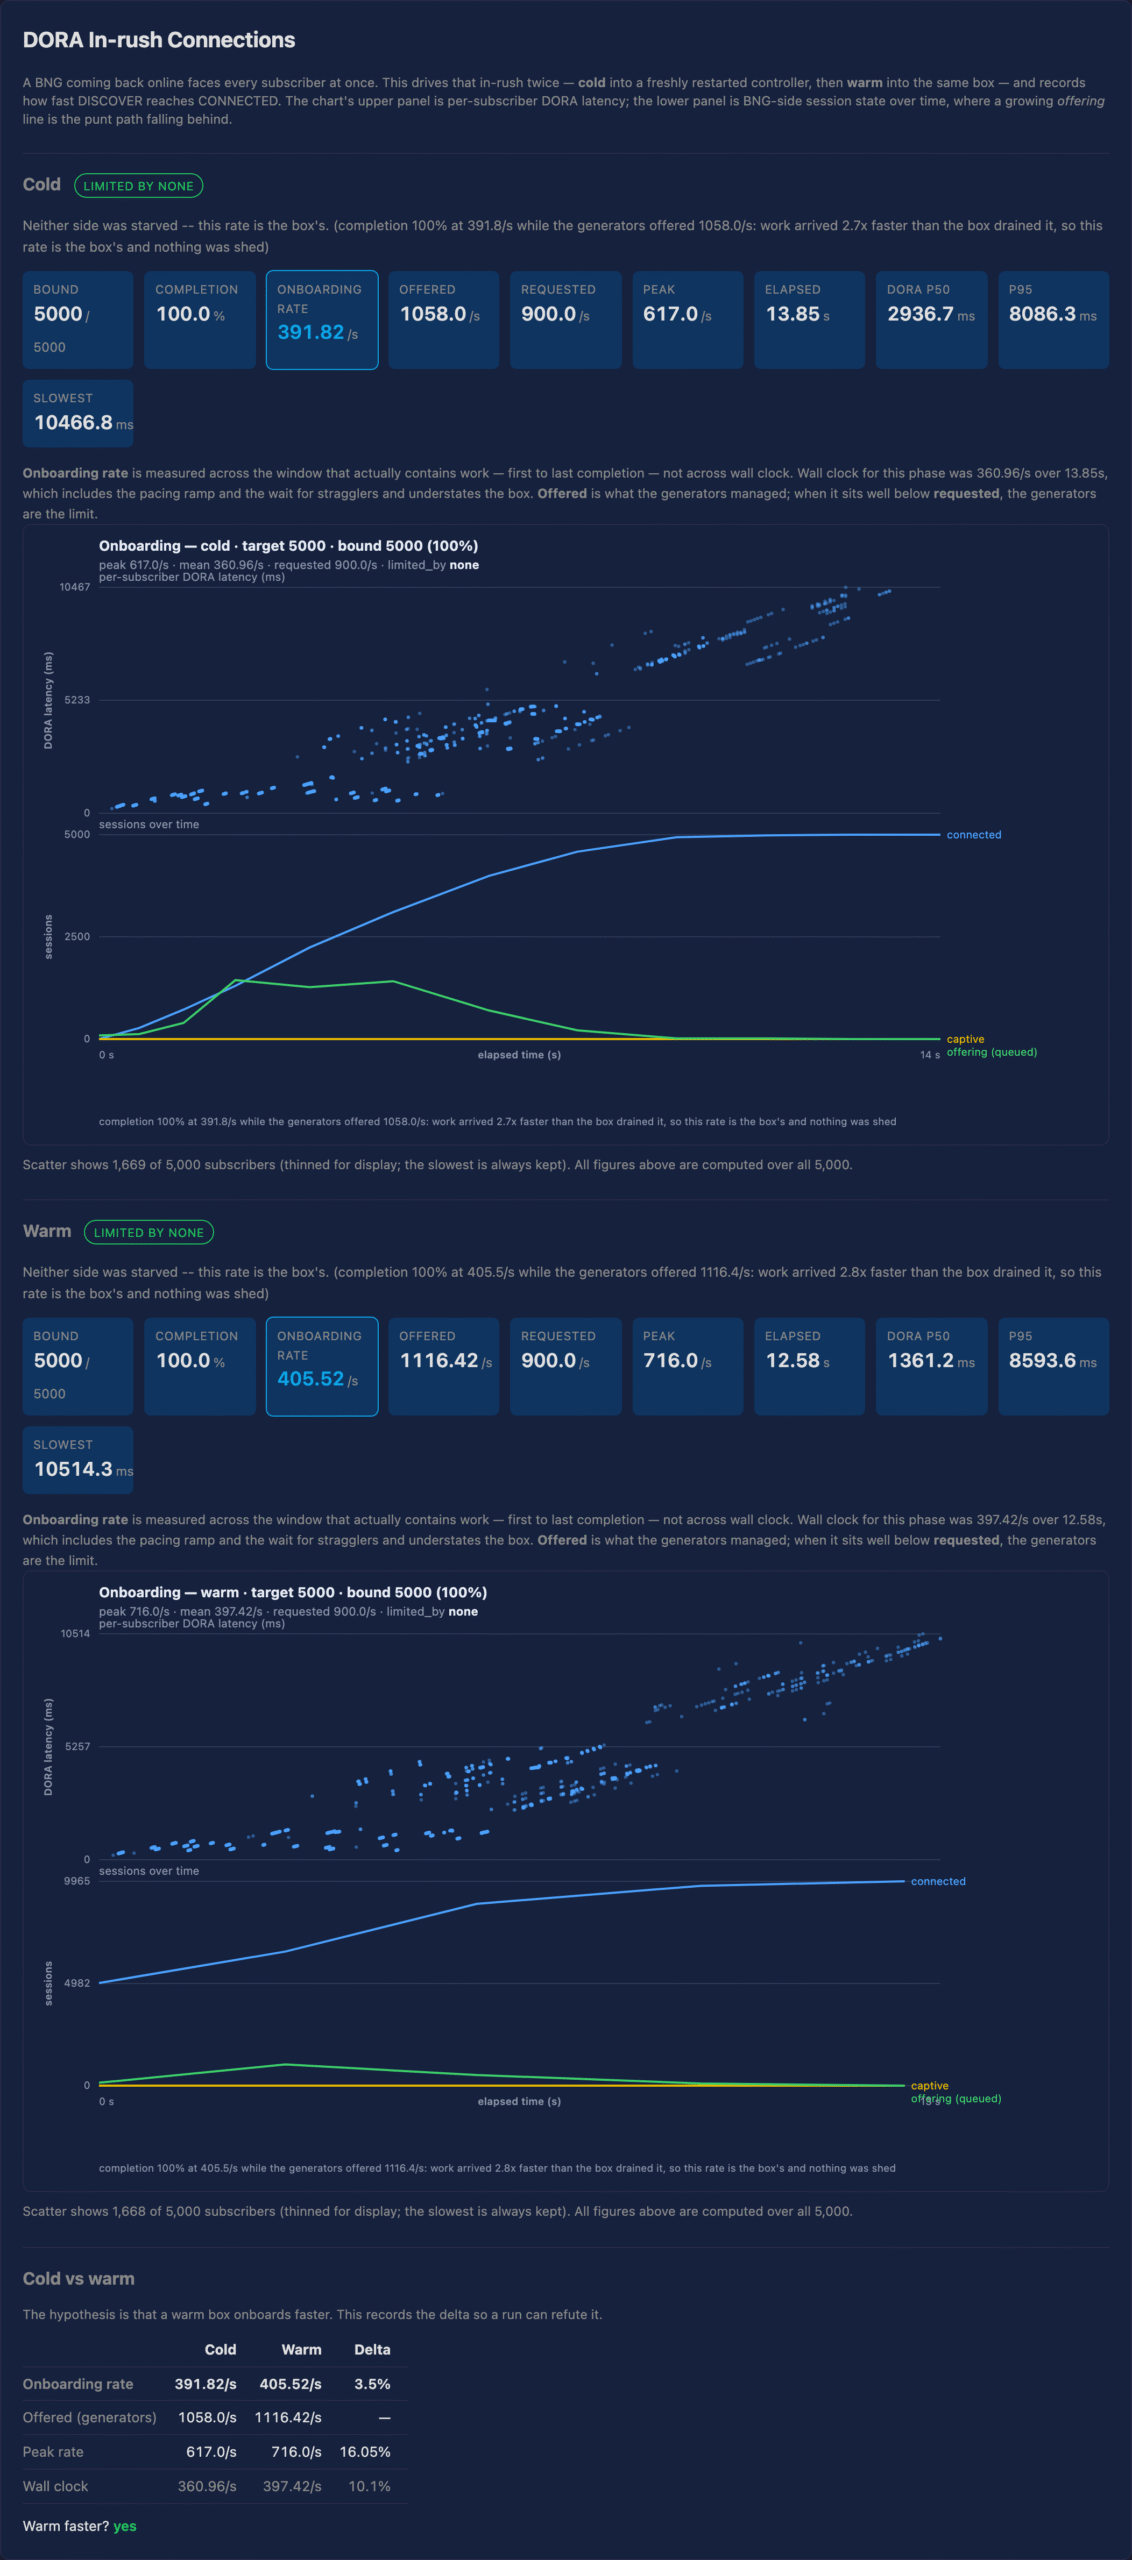
limited_by: none means neither the platform nor the generators saturated at
this offered level, so these are shape results rather than a ceiling. The warm
phase being ~3.5% faster than cold is the expected direction and small.
5.3 Capacity and cap enforcement
The licence granted bng.max_sessions = 25000; the working set was 5,000. The
capacity suite verifies the cap is read from the grant and enforced at its
boundary, with sessions beyond it moved to a captive state rather than dropped.
All capacity checks passed. No figure — this is a pass/fail surface, not a
measurement.
5.4 Churn and reconciliation — run-699-churn.json
What it measures. Half the fleet is released and re-established repeatedly
for 300 s, while client-side and controller-side session counts are compared.
Why it matters. Churn is normal ISP life — evenings, link flaps, CPE
reboots. The question is whether the platform's own view of its sessions stays
truthful under it.
| Integrity | 1.0 |
| Converged | yes, in 25.1 s |
| Maximum divergence | 391 sessions |
| Leaked sessions | none (empty list, enumerated) |
| Orphaned sessions | none (empty list, enumerated) |
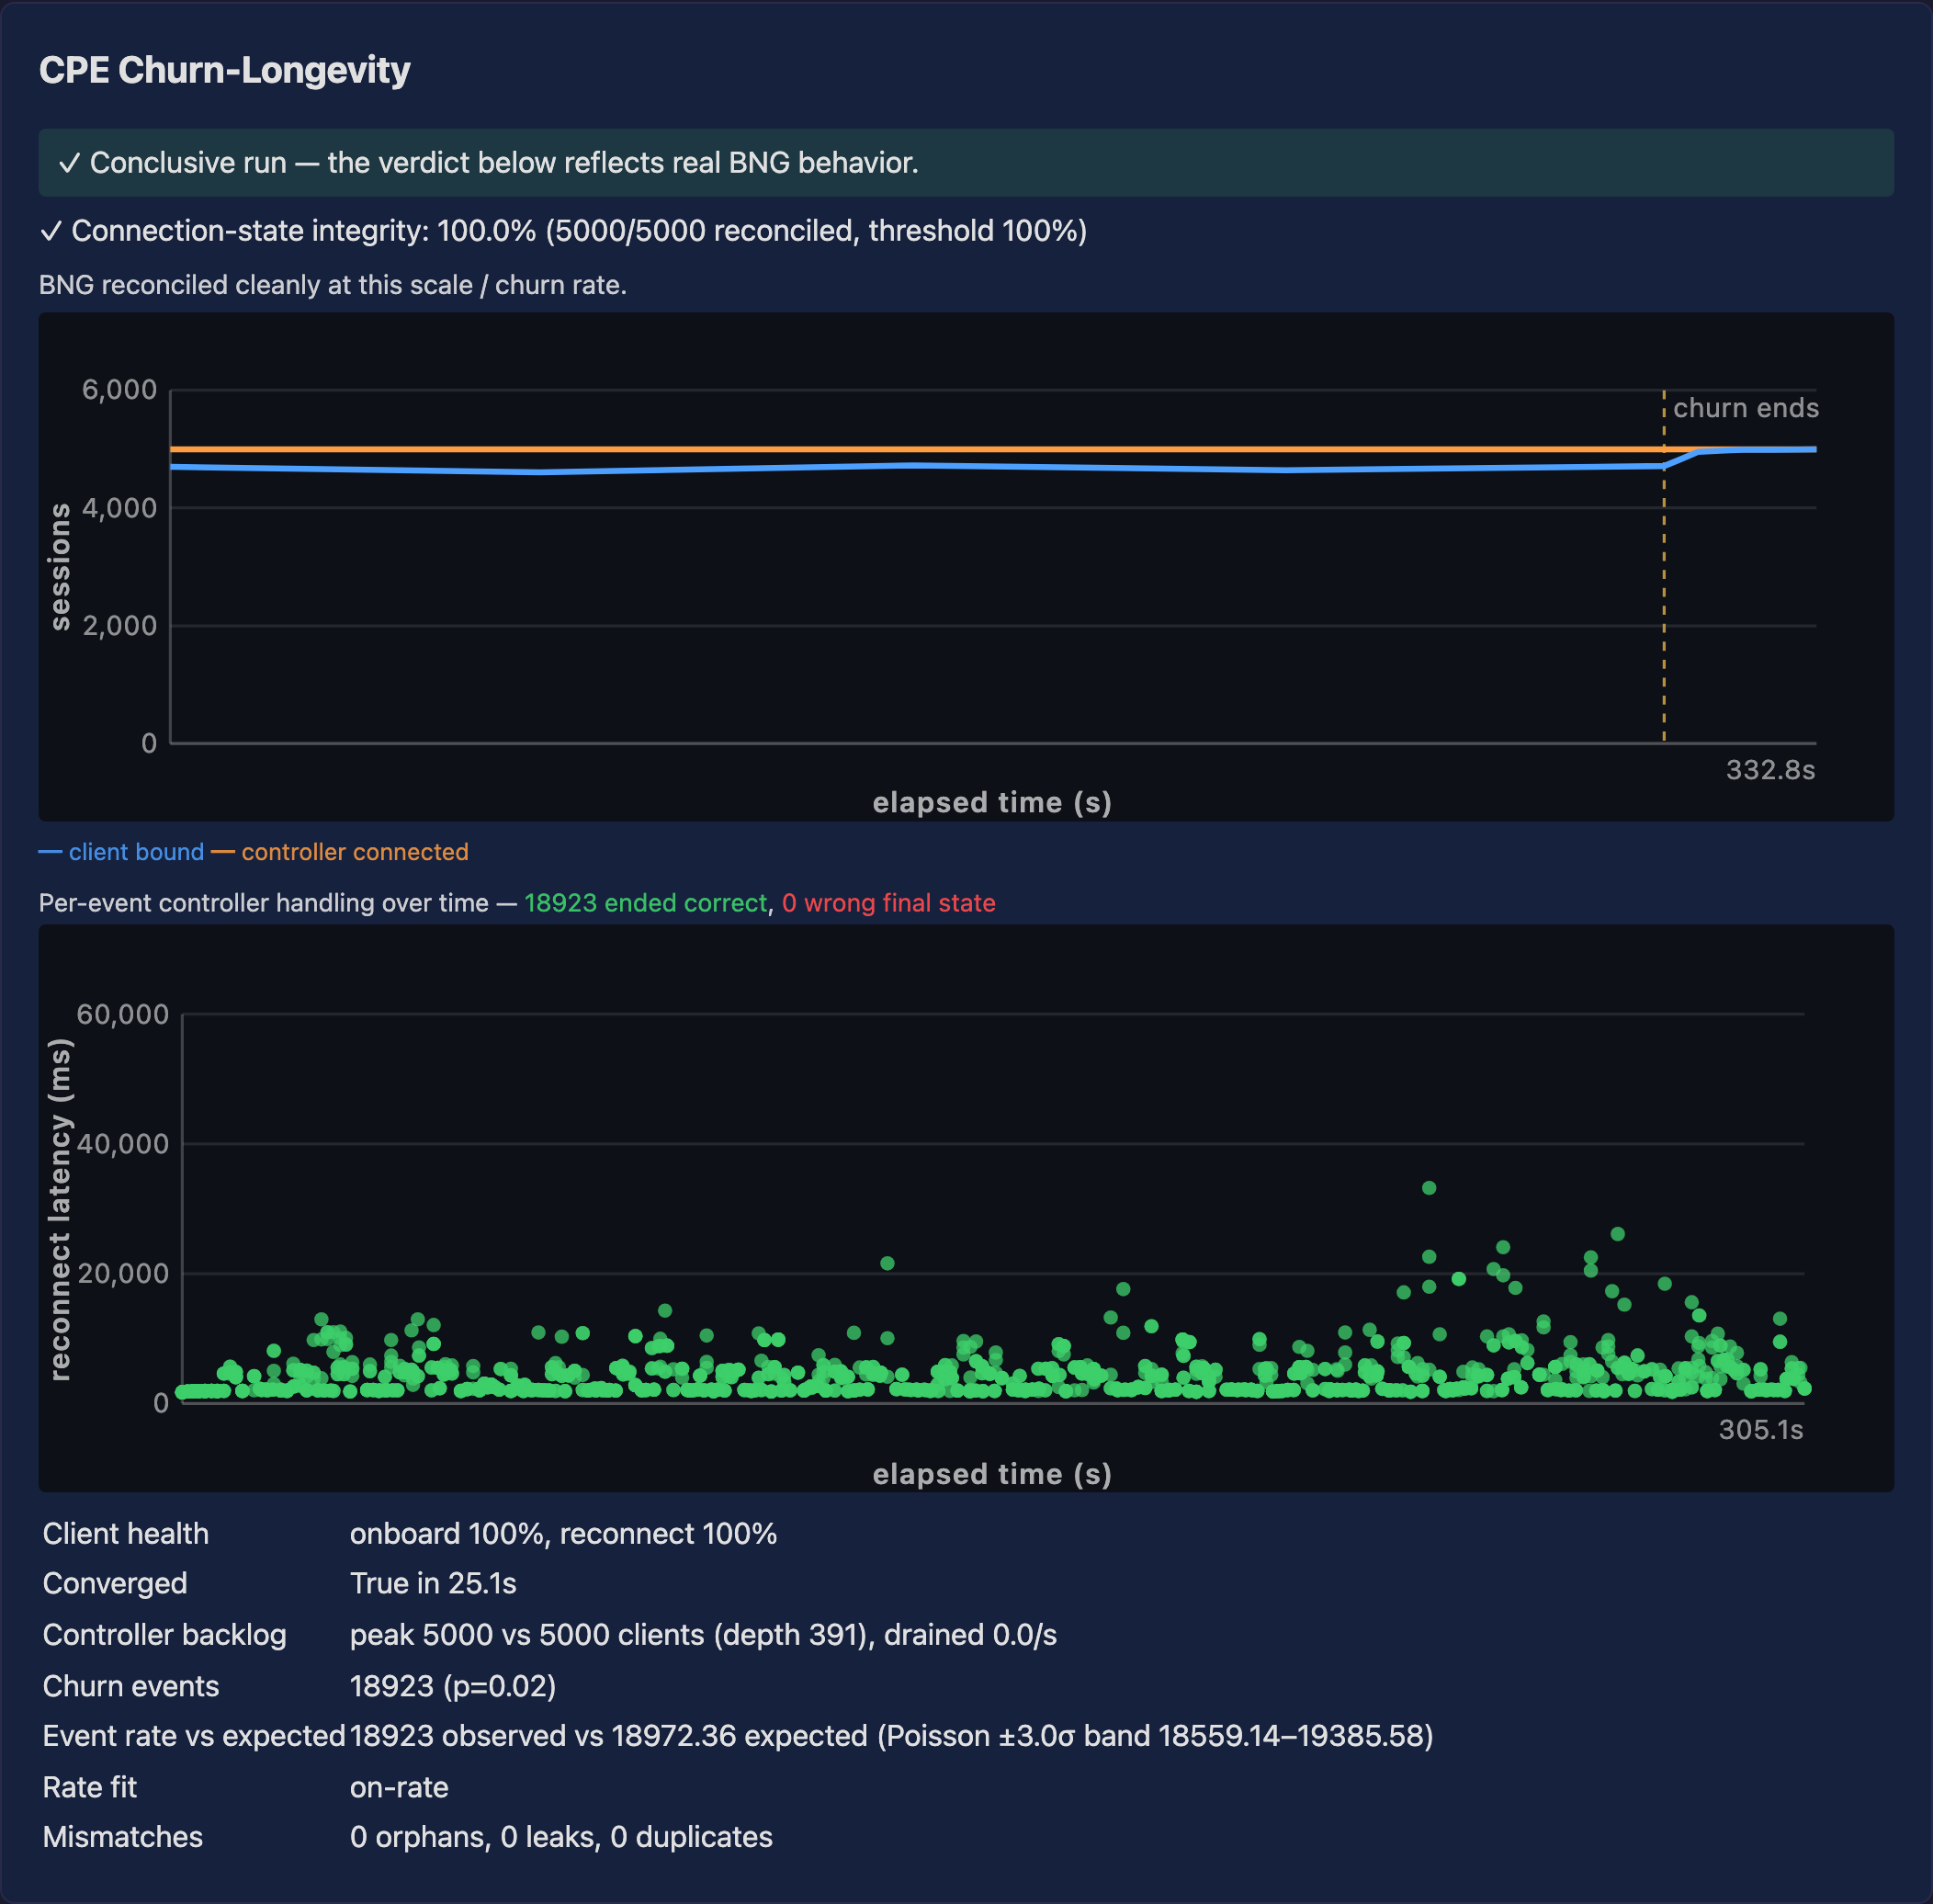
The leak and orphan results are enumerated, not derived. This matters: a
leak count computed as total − final_bound is an arithmetic identity and
proves nothing. These are empty lists of specific sessions, which is evidence.
5.5 Lease churn — run-699-leasechurn.json
What it measures. A cohort is held stable while another half churns around
it, checking the stable cohort is neither disturbed nor lost from the view.
| Cohort size | 2,500 |
| Stable cohort | 2,500 |
| Stable sessions bound | correct throughout |
| Stable sessions in controller view | correct throughout |
| Lease renewal exercised | no |
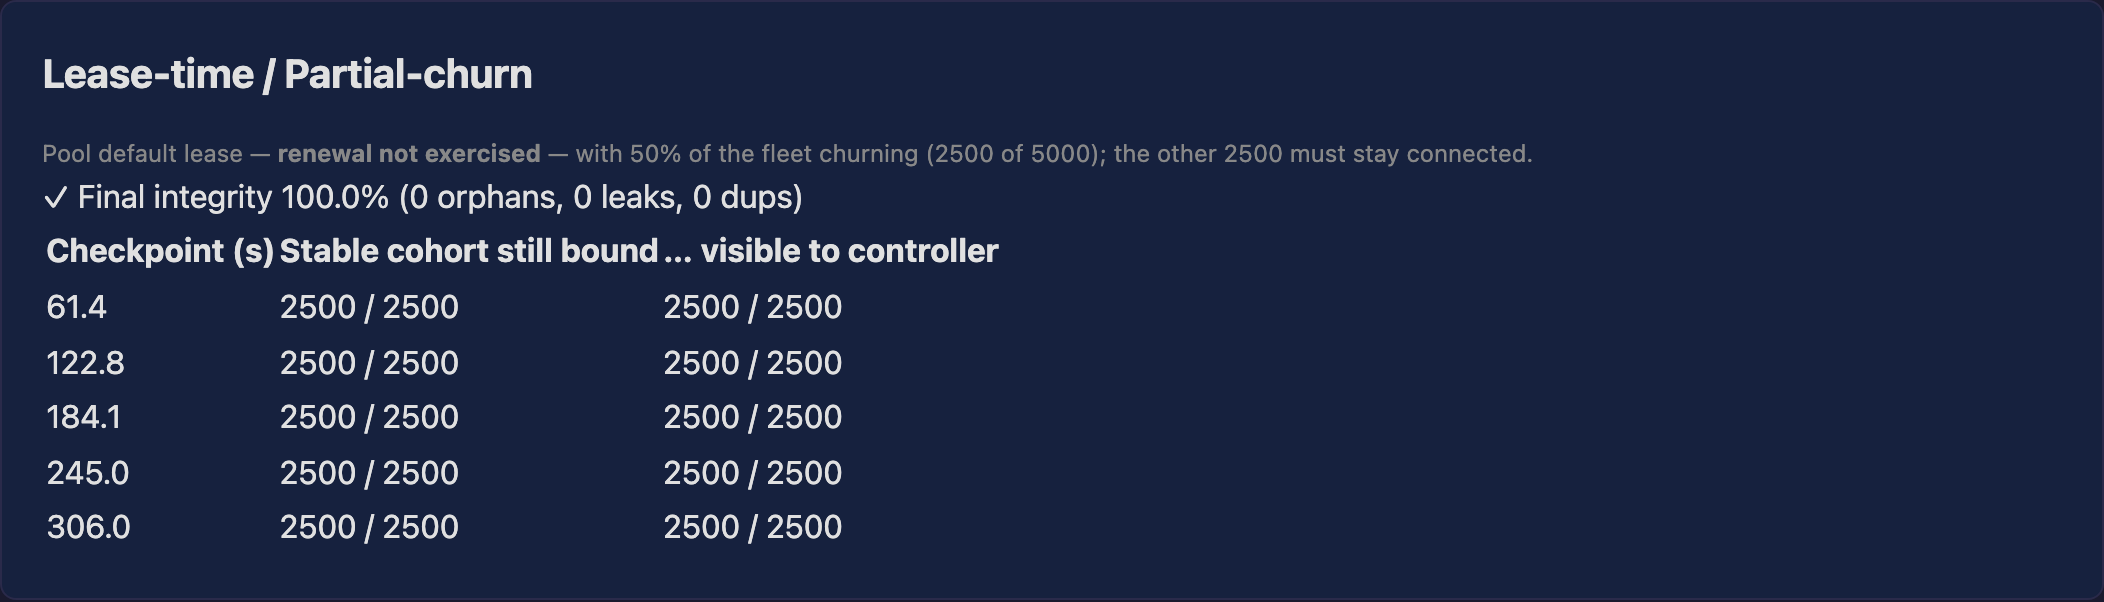
Two caveats, both important. First, the stable cohort was genuinely 2,500 —
worth stating because a stable cohort of zero would make this check pass
while testing nothing. Second, lease_renewal_exercised is false: the lease
time was not shortened for this run, so no lease actually reached renewal inside
the window. The cohort's continuity is real; lease renewal under churn is not
covered by this run.
5.6 Traffic forwarding and QoS — run-699-cpe.json
What it measures. Two distinct workloads, which must not be conflated.
A bulk throughput phase drives downstream HTTP reads to find aggregate
capacity; a separate shaping phase drives per-subscriber traffic through the
policer and compares each subscriber's achieved rate against its plan.
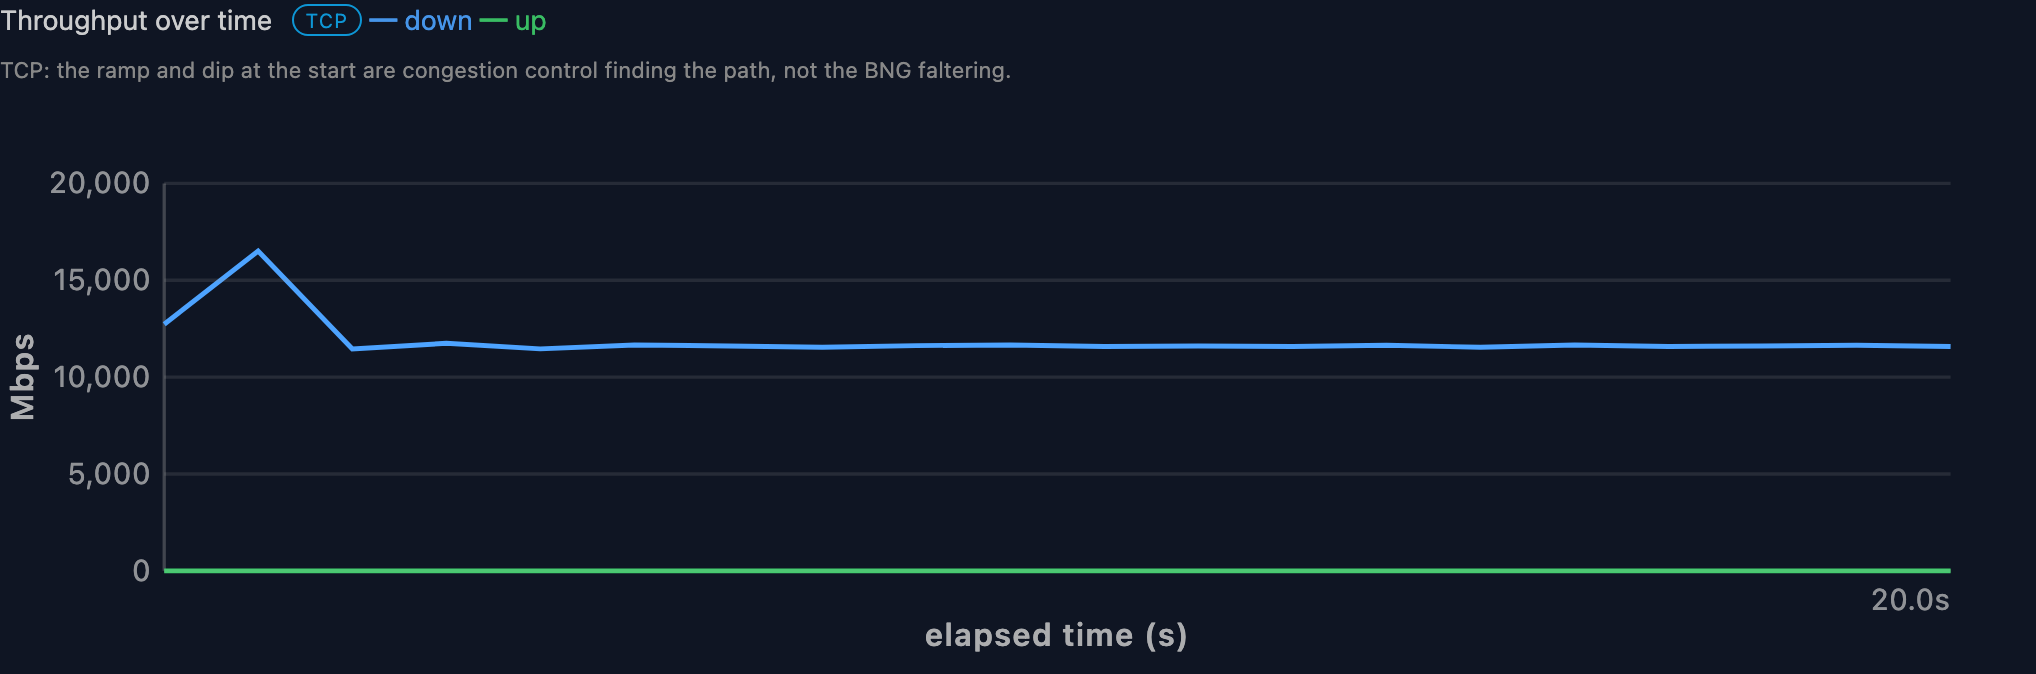
Bulk throughput (downstream)
| Downstream mean | 11,710 Mbps (11.7 Gbps) |
| Downstream peak | 16,505 Mbps (16.5 Gbps) |
| Transferred | 30.17 GB in 20.6 s |
| Upstream | negligible — this phase is a downstream-dominant HTTP read |
Per-subscriber shaping
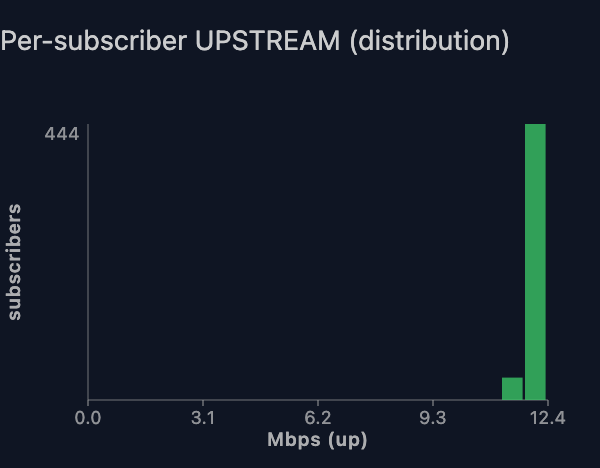
480 subscribers were sampled and measured in both directions against the
Bronze plan (25 Mbps down / 12 Mbps up ceilings):
| Within contract | 480 of 480 |
| Silent (moved no traffic) | 0 |
| Unresolved | 0 |
| Downstream median | 22.14 Mbps against a 25 Mbps ceiling |
| Upstream median | 10.93 Mbps against a 12 Mbps ceiling |
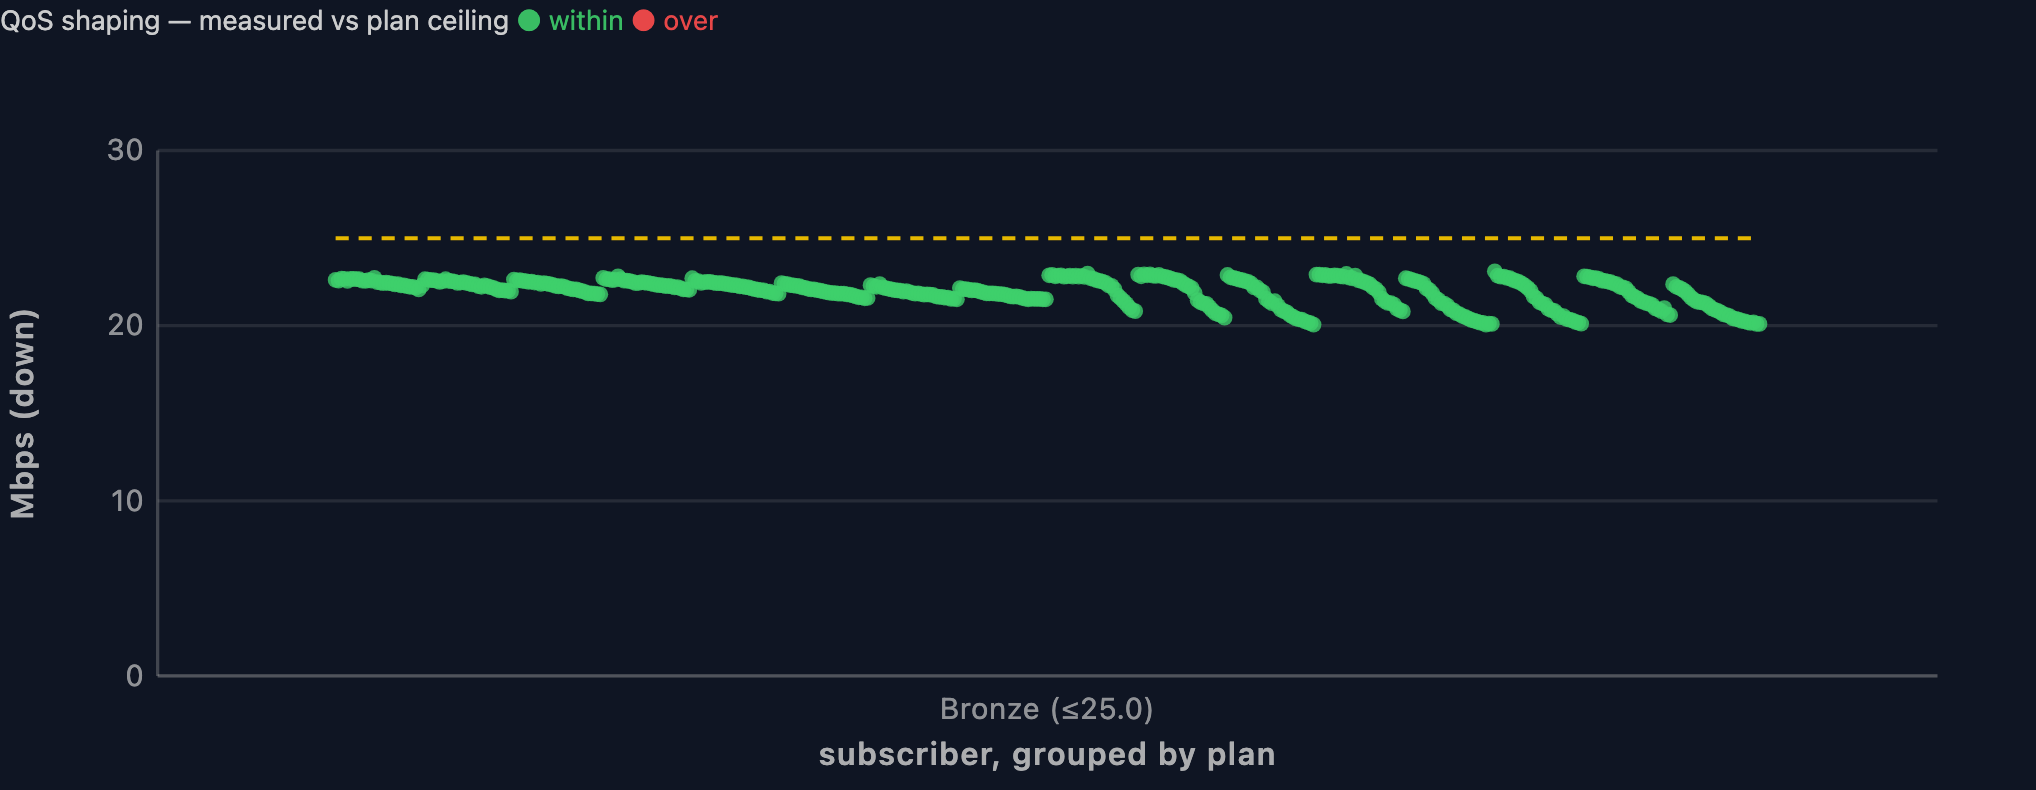
The silent: 0 and unresolved: 0 counts carry weight: a subscriber that moved
no traffic is reported in its own category rather than counted as compliant, so
480 of 480 is 480 real measurements rather than a pass inflated by silence.
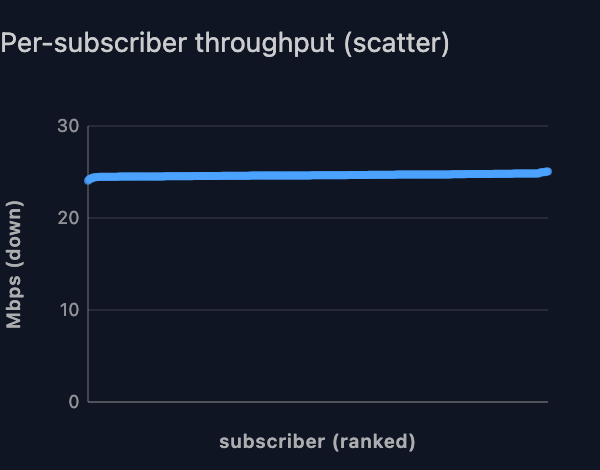
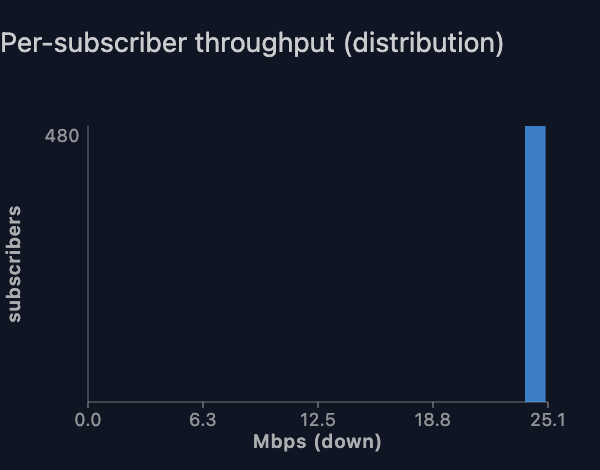
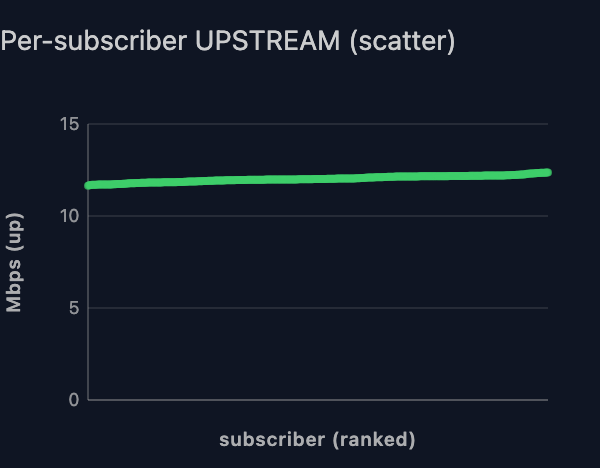
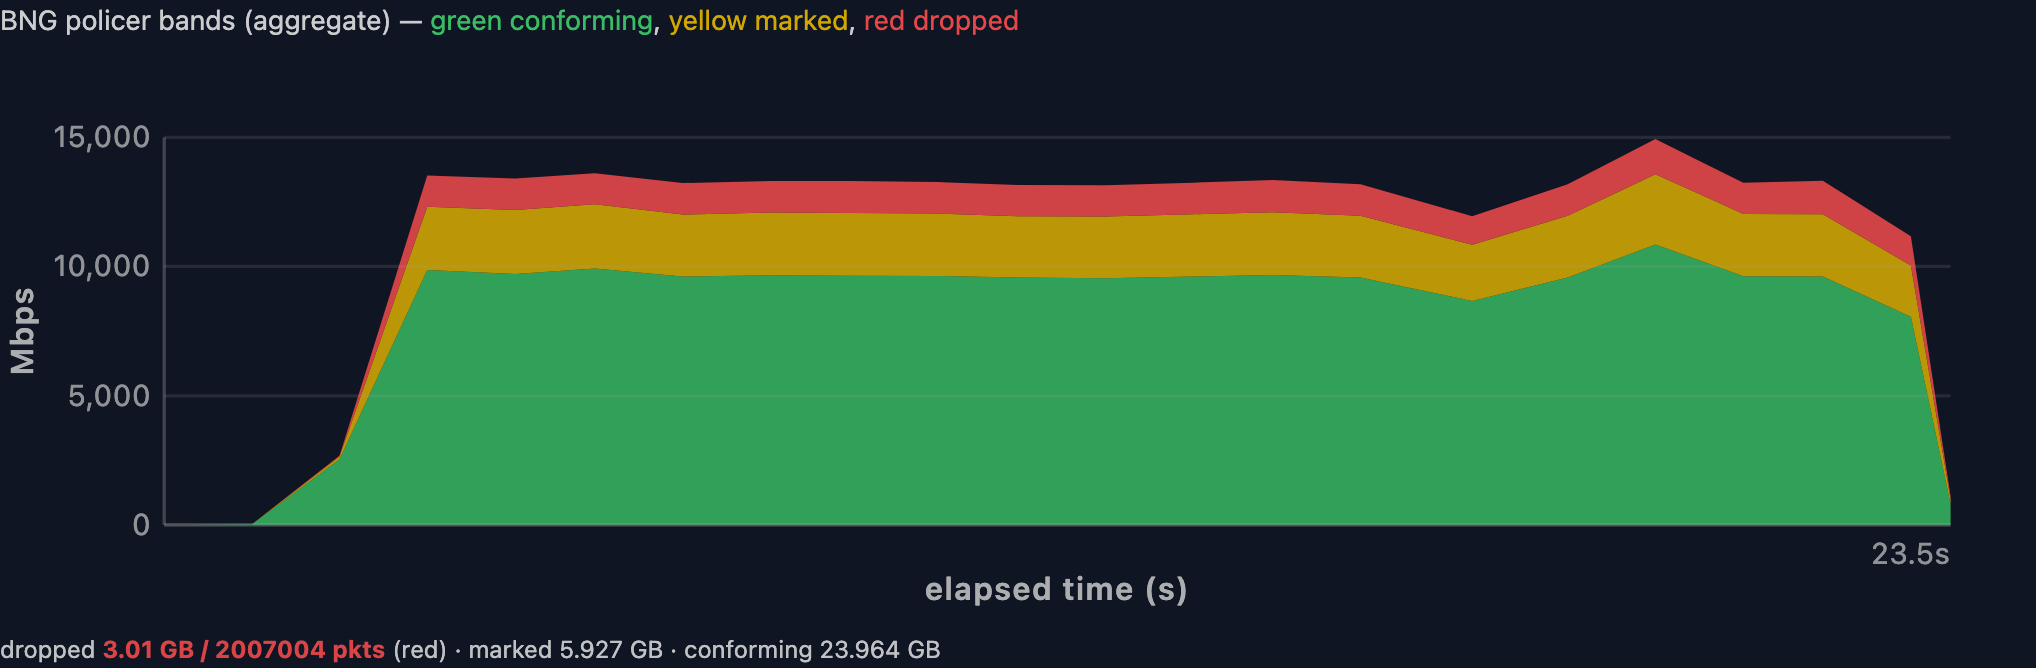
The policer, actively marking
Both directions carried real load through the policer, and the colour split is
the result worth publishing because it shows the policer doing work rather than
merely passing traffic. Figures are the totals the panels themselves report.
Downstream — 32.90 GB over 23.5 s (≈11.2 Gbps mean, ~15 Gbps peak):
| Colour | Volume | Share |
|---|---|---|
| Green (conforming) | 23.964 GB | 72.8% |
| Yellow (marked out-of-contract) | 5.927 GB | 18.0% |
| Red (dropped) | 3.010 GB / 2,007,004 pkts | 9.1% |
Upstream — 30.72 GB over 29.7 s (≈8.3 Gbps mean, ~12.3 Gbps peak):
| Colour | Volume | Share |
|---|---|---|
| Green (conforming) | 19.884 GB | 64.7% |
| Yellow (remarked) | 10.336 GB | 33.6% |
| Red (dropped) | 0.502 GB / 334,895 pkts | 1.6% |
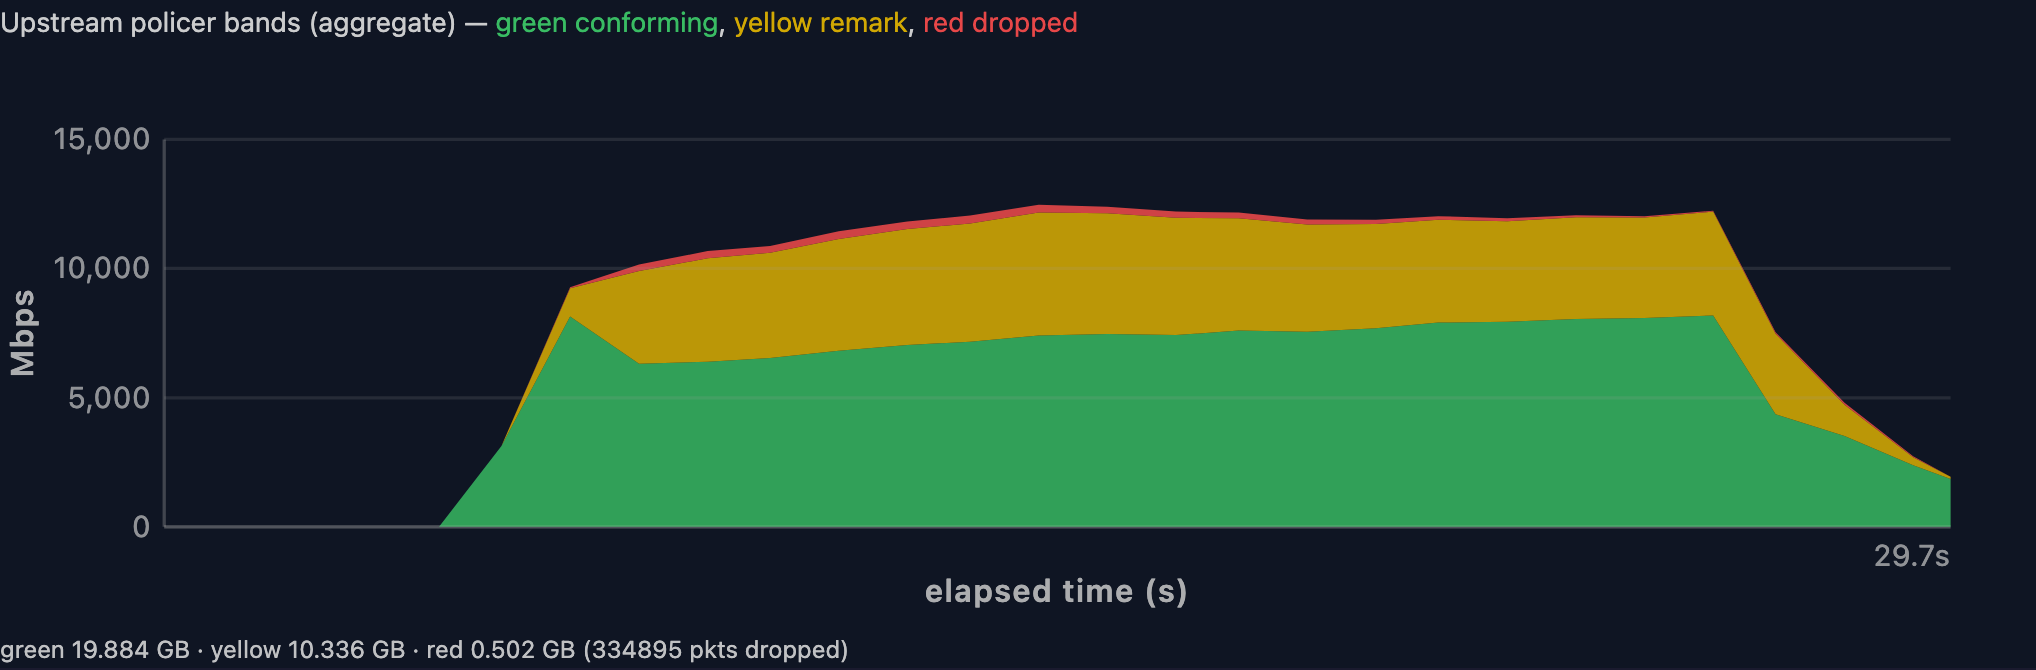
Roughly a quarter of offered traffic downstream, and a third upstream, was
deliberately over-contract, and the policer classified every bit of it. That is
the enforcement path working end to end under multi-gigabit load in both
directions, not an idle-path check.
What this run does not establish. Neither direction is a search for a
forwarding ceiling — these are the shaping workload's offered rates, chosen to
exercise the policer. §5.7 is where forwarding limits are measured.
5.7 Forwarding performance and core scaling — run-699-coreperf.json
What it measures. A matrix of worker counts (1–5) against packet sizes
(64B, 128B, 512B, 1518B, plus a TCP profile), each cell recording throughput,
per-core efficiency, thread balance, and what limited it.
This is the section most easily misread, so start with the taxonomy. The
matrix covers 20 UDP cells — five worker counts against four frame sizes —
and sorts each into one of three kinds, which are not interchangeable:
| Kind | Cells | What it means |
|---|---|---|
| BNG ceiling | 4 | the box dropped packets — a real forwarding limit |
| Line rate, zero loss | 13 | the box forwarded everything offered, at 90% of link, with zero loss |
| Floor — rig under-offered | 3 | the box kept up but the rig never filled the link |
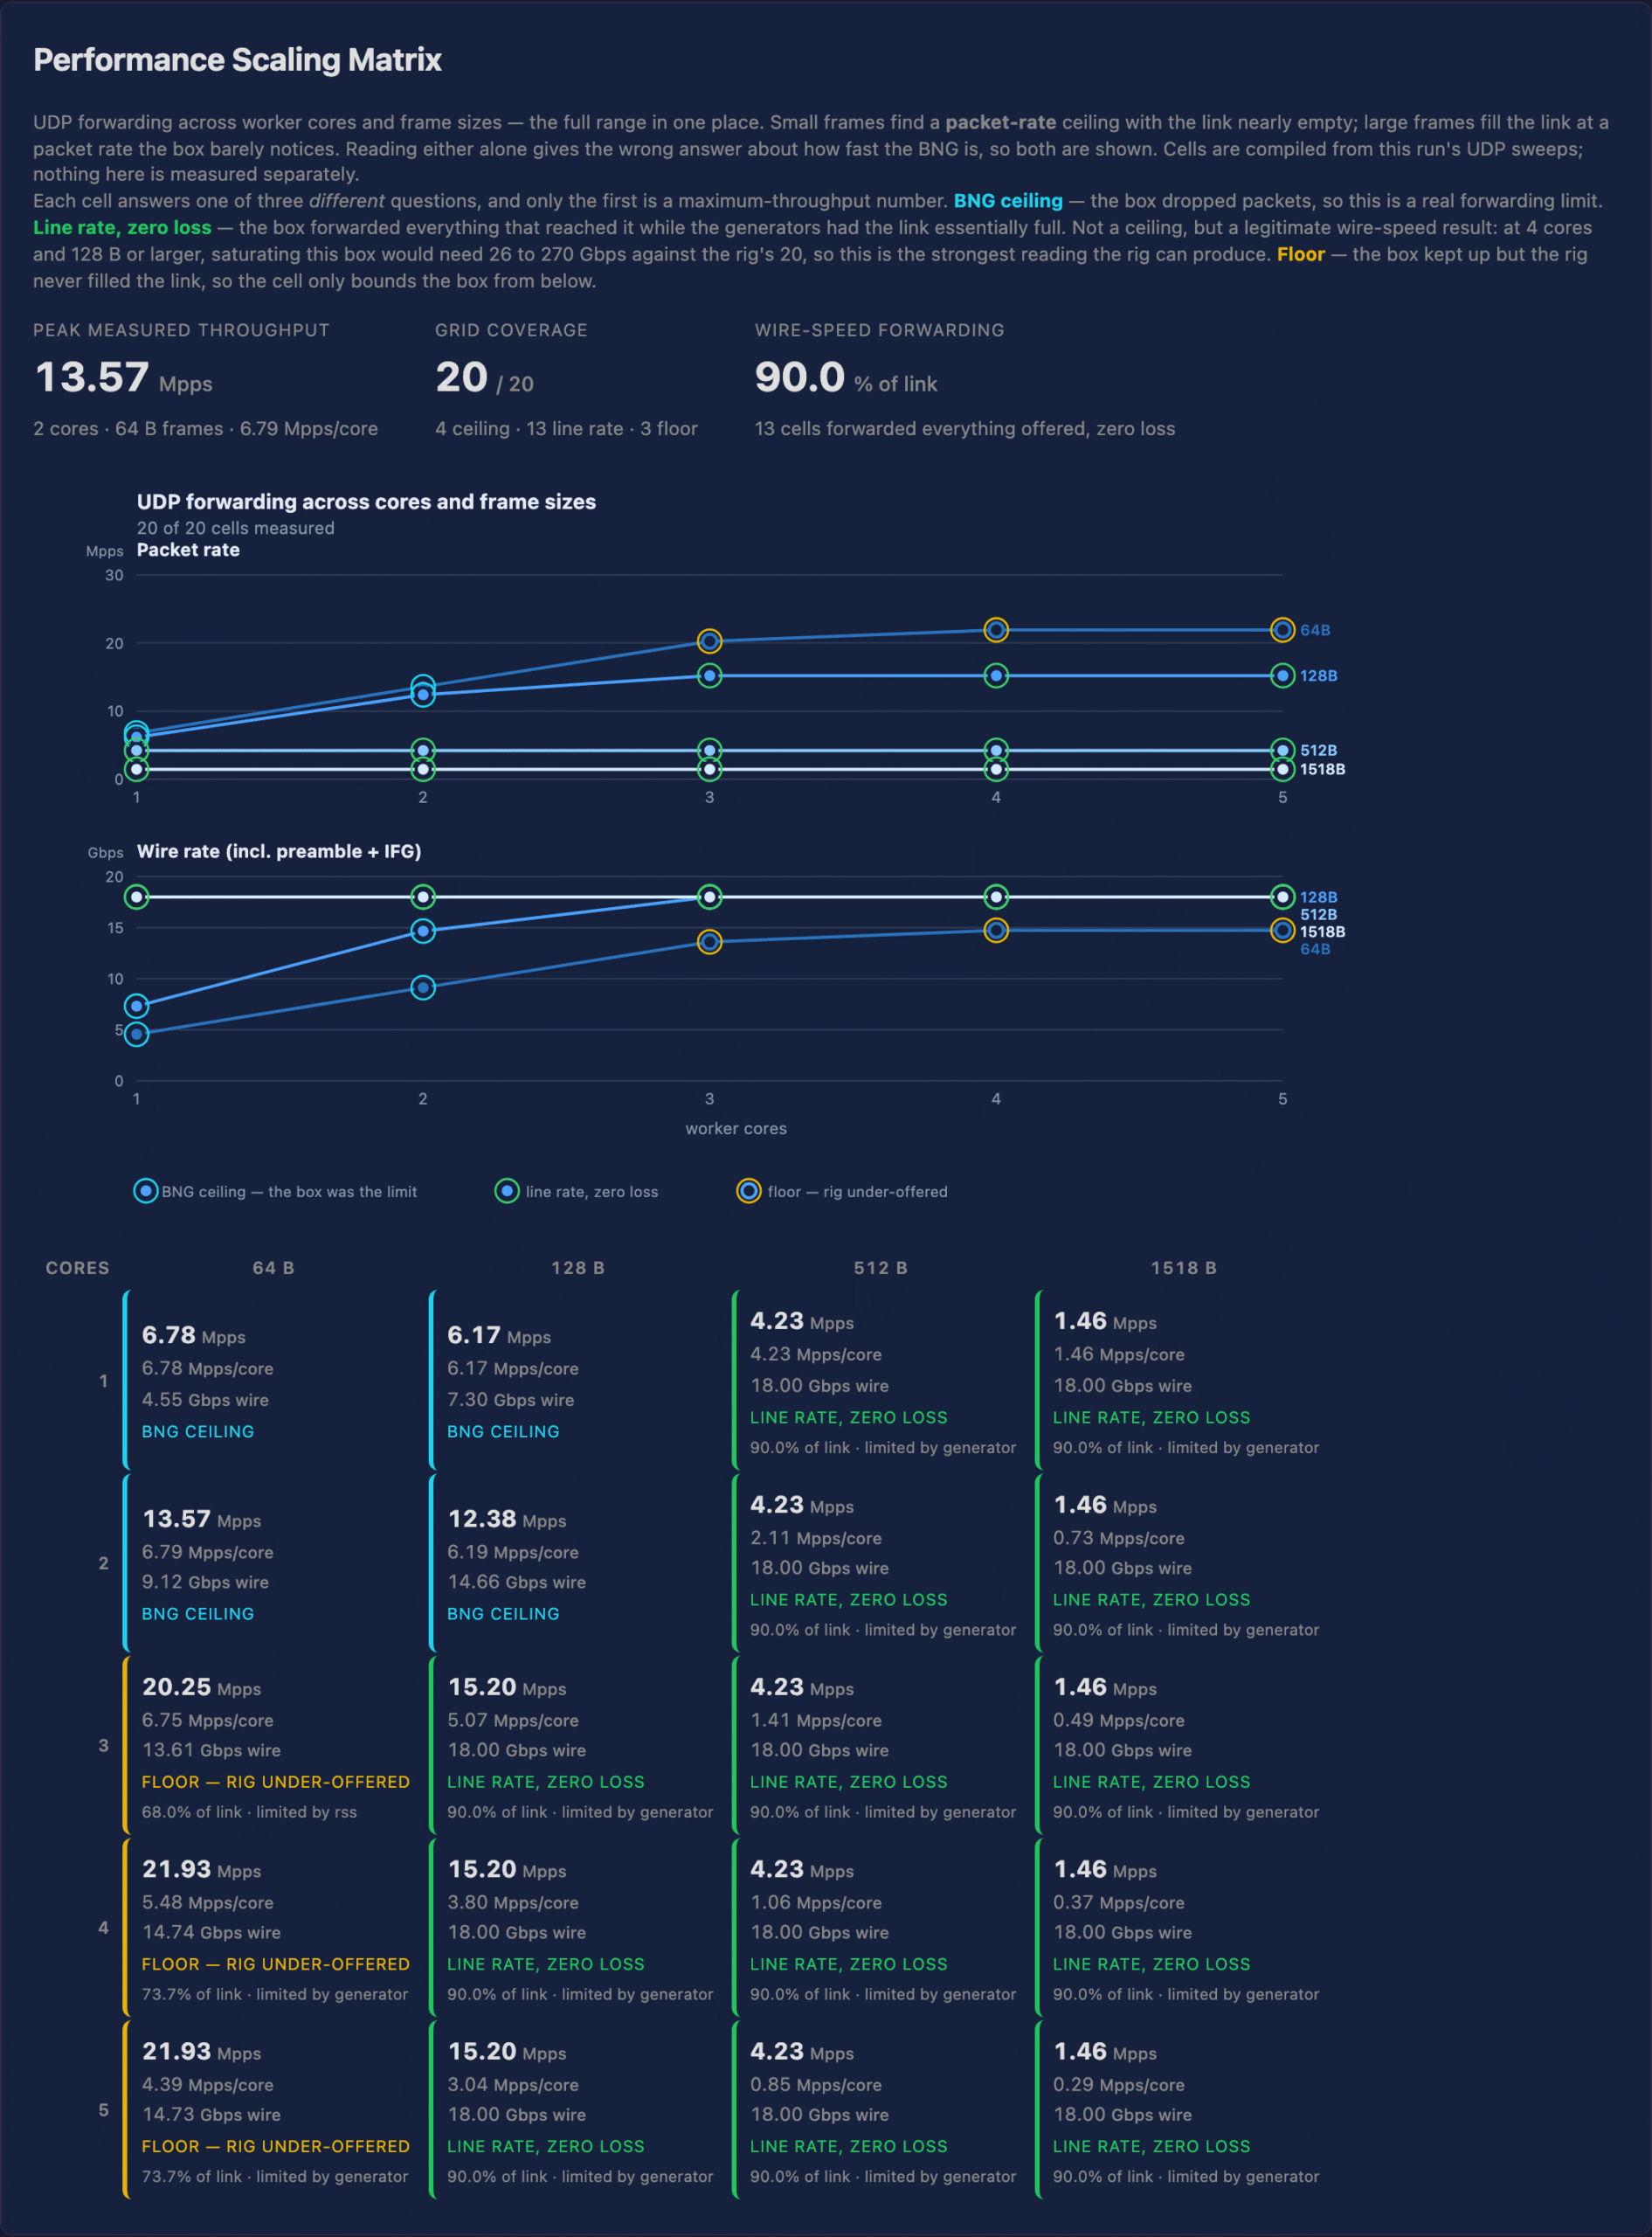
Only the 4 ceiling cells are maximum-throughput numbers. But the 13
line-rate cells are not merely "our generators ran out" either — they are
legitimate wire-speed results: the box forwarded every packet that reached it
while the link was essentially full. At 4 workers and 128 B or larger,
saturating this box would need 26 to 270 Gbps against the rig's 20, so those
cells are the strongest reading this rig can produce rather than a shortfall.
Only the 3 floor cells are genuine under-offers.
The run's JSON additionally carries 4 TCP-profile cells, which the matrix does
not render; all four are generator-limited and no figure in this report is drawn
from them.
Only these four cells measure the platform:
| Workers | Packet size | Throughput | Per core | Cycles/packet |
|---|---|---|---|---|
| 1 | 64B | 6.78 Mpps | 3.25 Gbps | ~330 |
| 1 | 128B | 6.17 Mpps | 6.12 Gbps | ~344 |
| 2 | 64B | 13.57 Mpps | 3.26 Gbps | ~330 |
| 2 | 128B | 12.38 Mpps | 6.14 Gbps | ~345 |
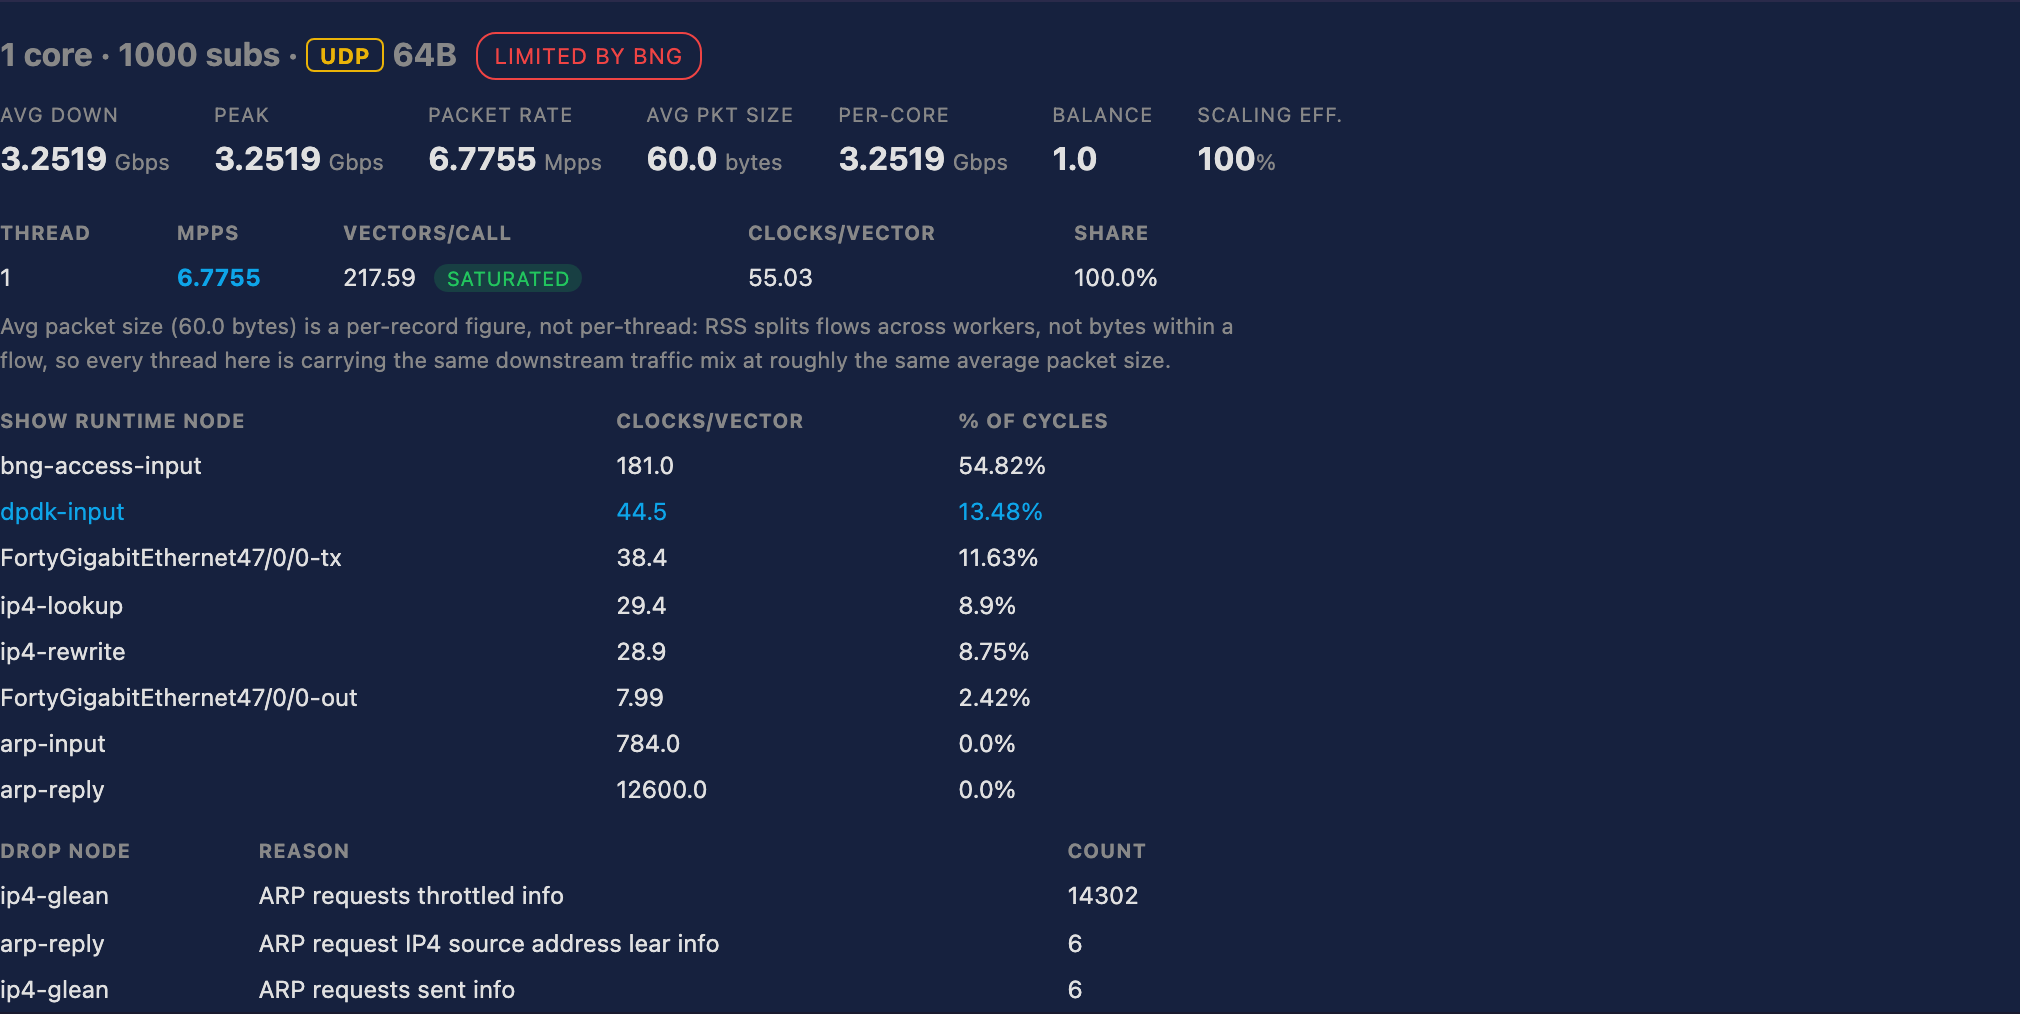
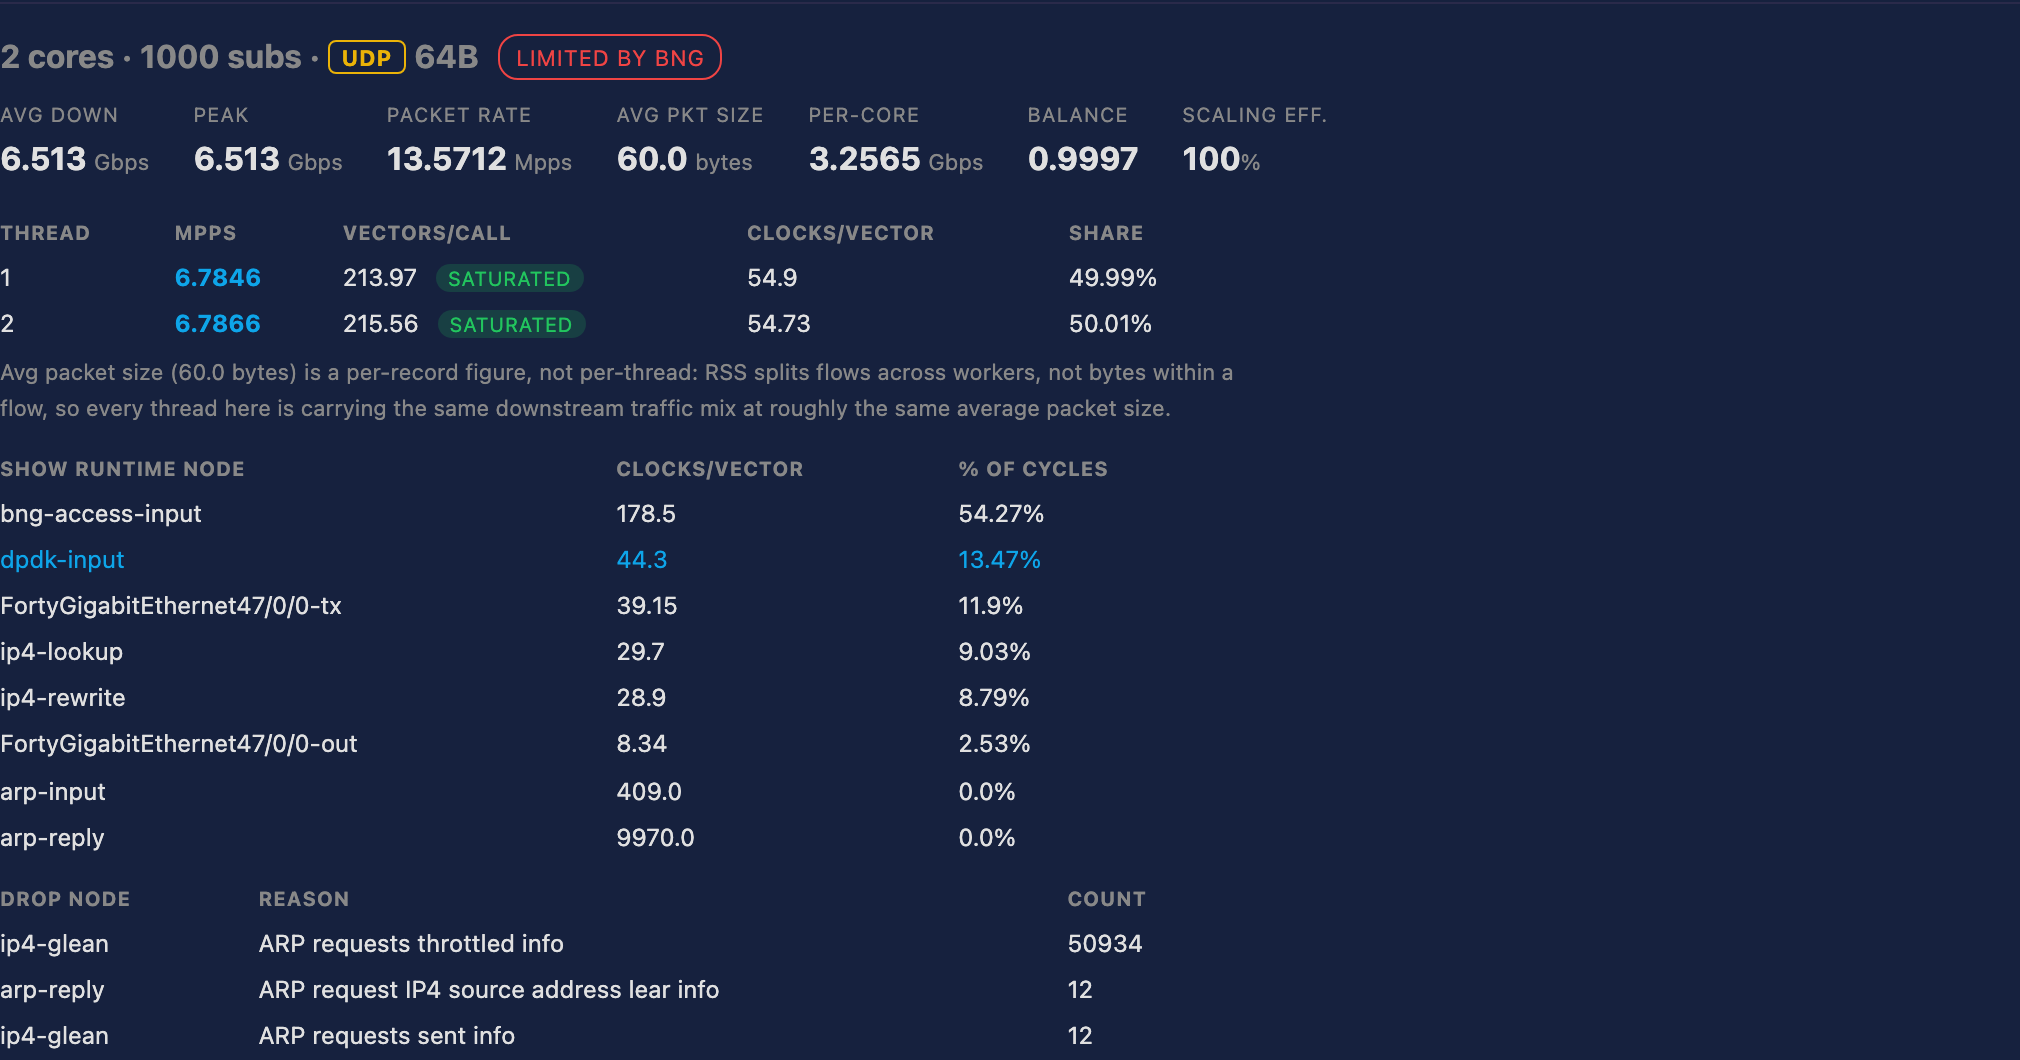
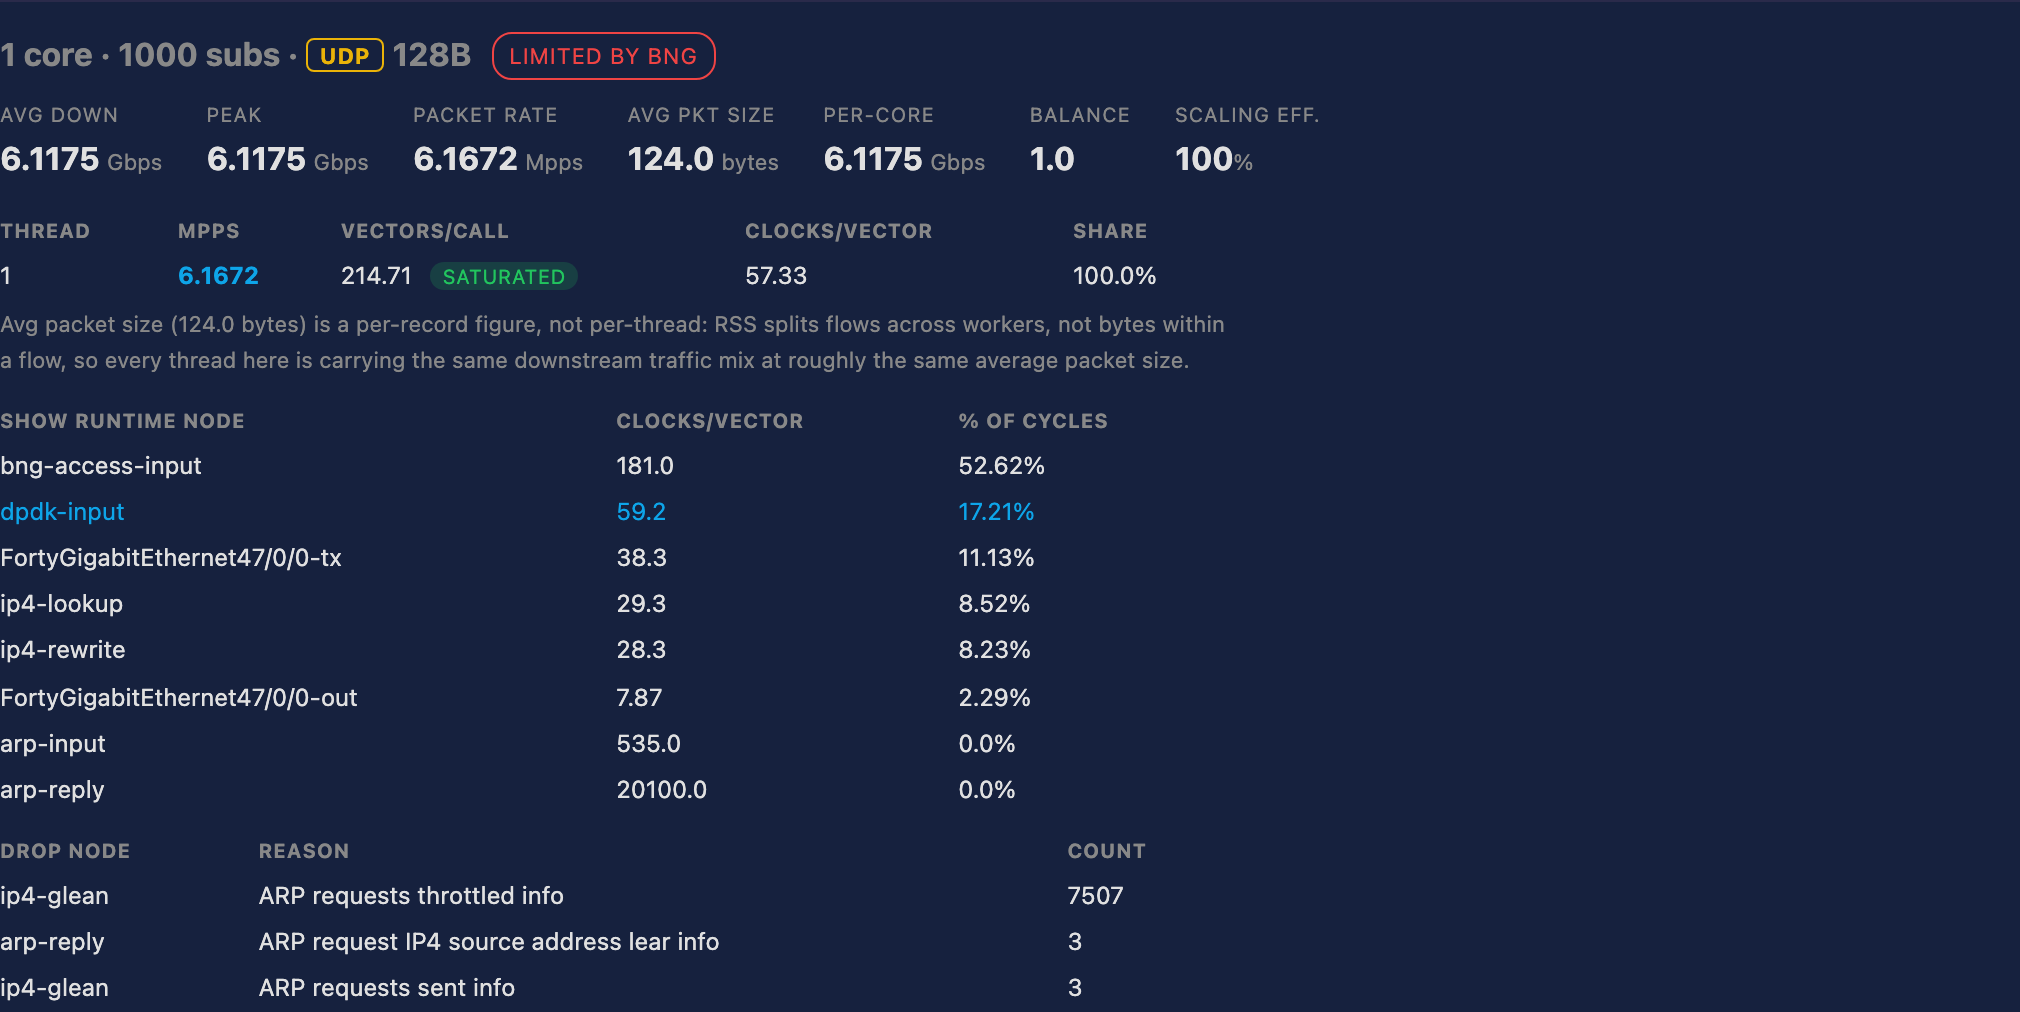
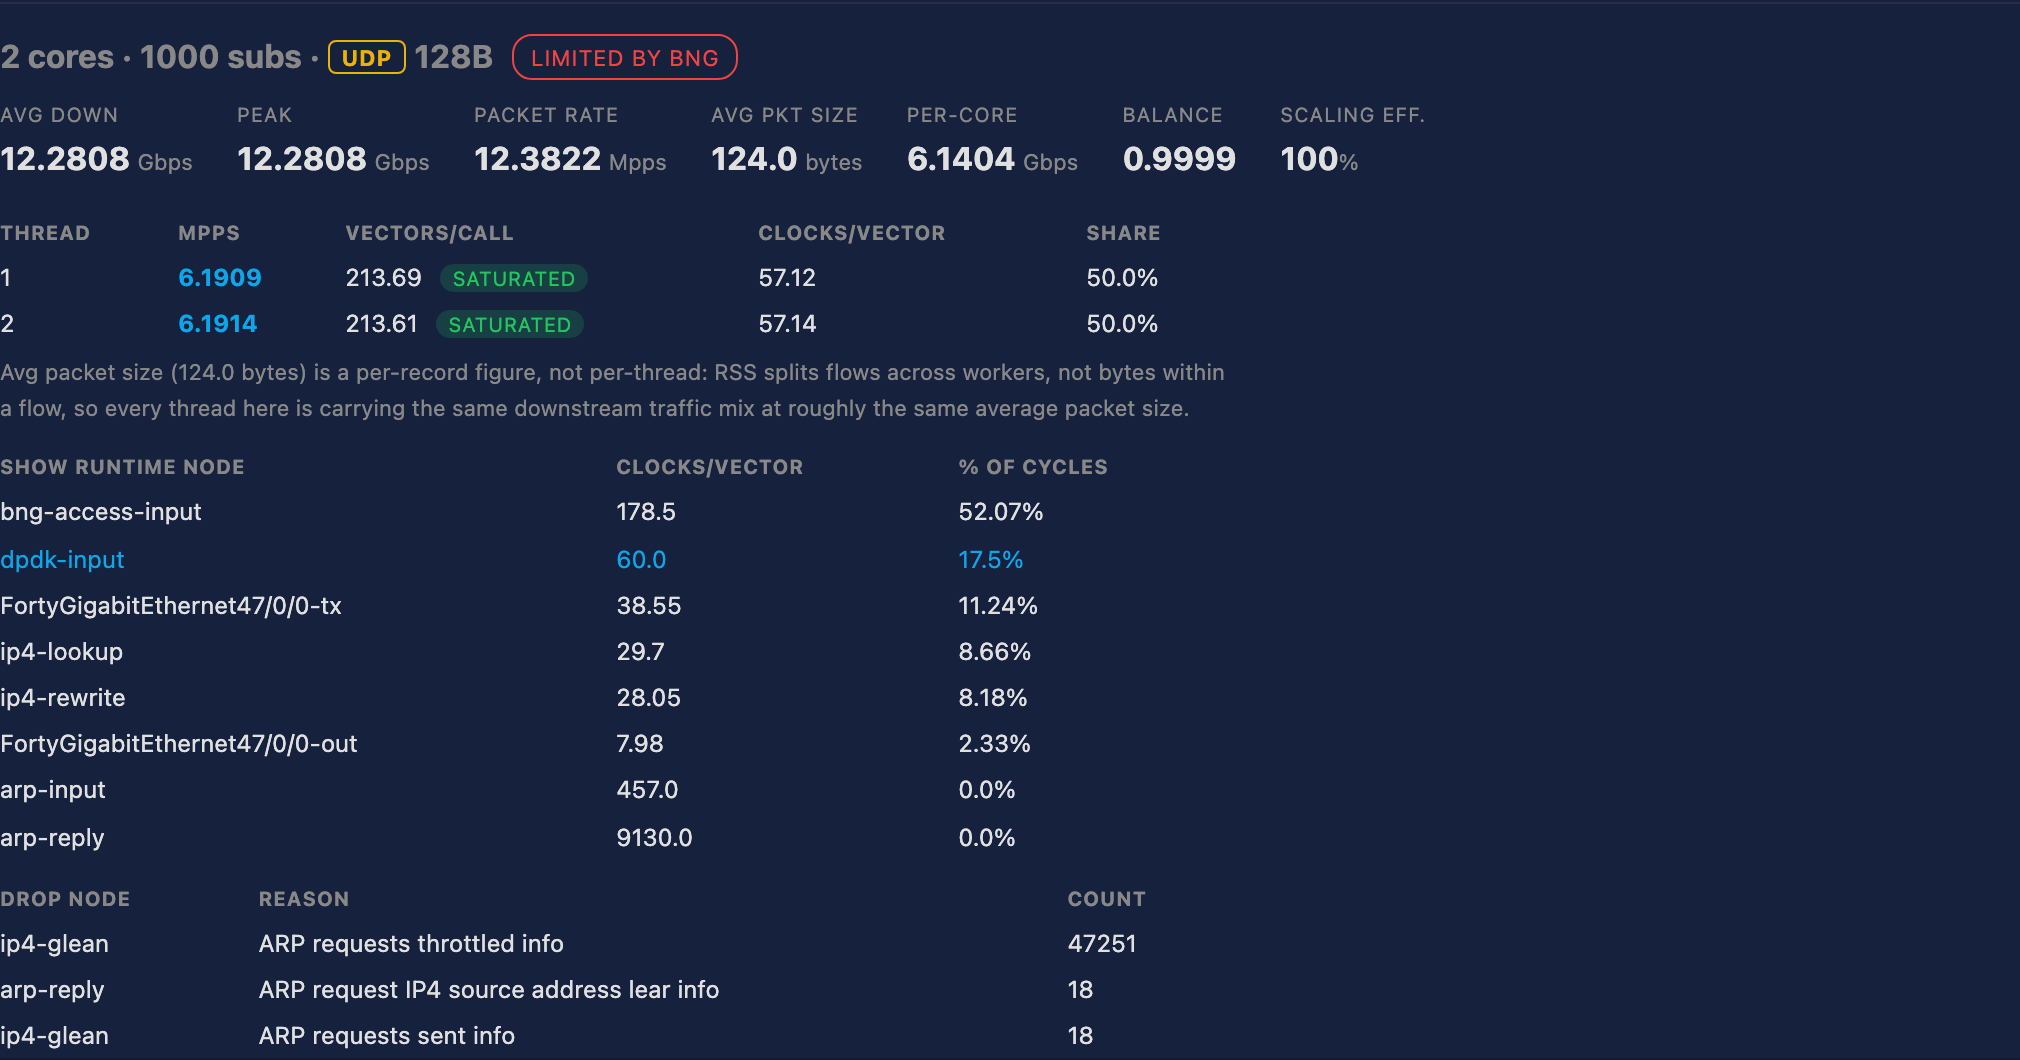
Scaling from one worker to two is near-linear — 6.78 → 13.57 Mpps at 64B is
2.00×, and per-core throughput is unchanged (3.25 → 3.26 Gbps). That is the
useful result in this section: the forwarding path scales with cores rather than
contending.
Per-packet cost is measured, not derived. clocks_per_vector × nodes_per_packet gives ~330 cycles per packet at 64B. This is the most durable
efficiency figure in the report because it survives hardware comparison: on a
2.0 GHz core, 330 cycles is ~165 ns of CPU per packet.
Thread balance is 0.9997–1.0 across the multi-worker cells, confirming the
one-queue-per-worker placement in §3.3 distributes evenly.
The generator ceiling is demonstrated, not merely asserted. A
platform-limited number rises when workers are added. The generator-limited
cells do not move at all — they are byte-identical across every worker count:
| Packet size | 1 worker | 2 | 3 | 4 | 5 |
|---|---|---|---|---|---|
| 512B | 4.229 Mpps | 4.229 | 4.229 | 4.229 | 4.229 |
| 1518B | 1.463 Mpps | 1.463 | 1.463 | 1.463 | 1.463 |
| 128B | bng | bng | 15.2 | 15.2 | 15.2 |
| 64B | bng | bng | rss | 21.93 | 21.93 |
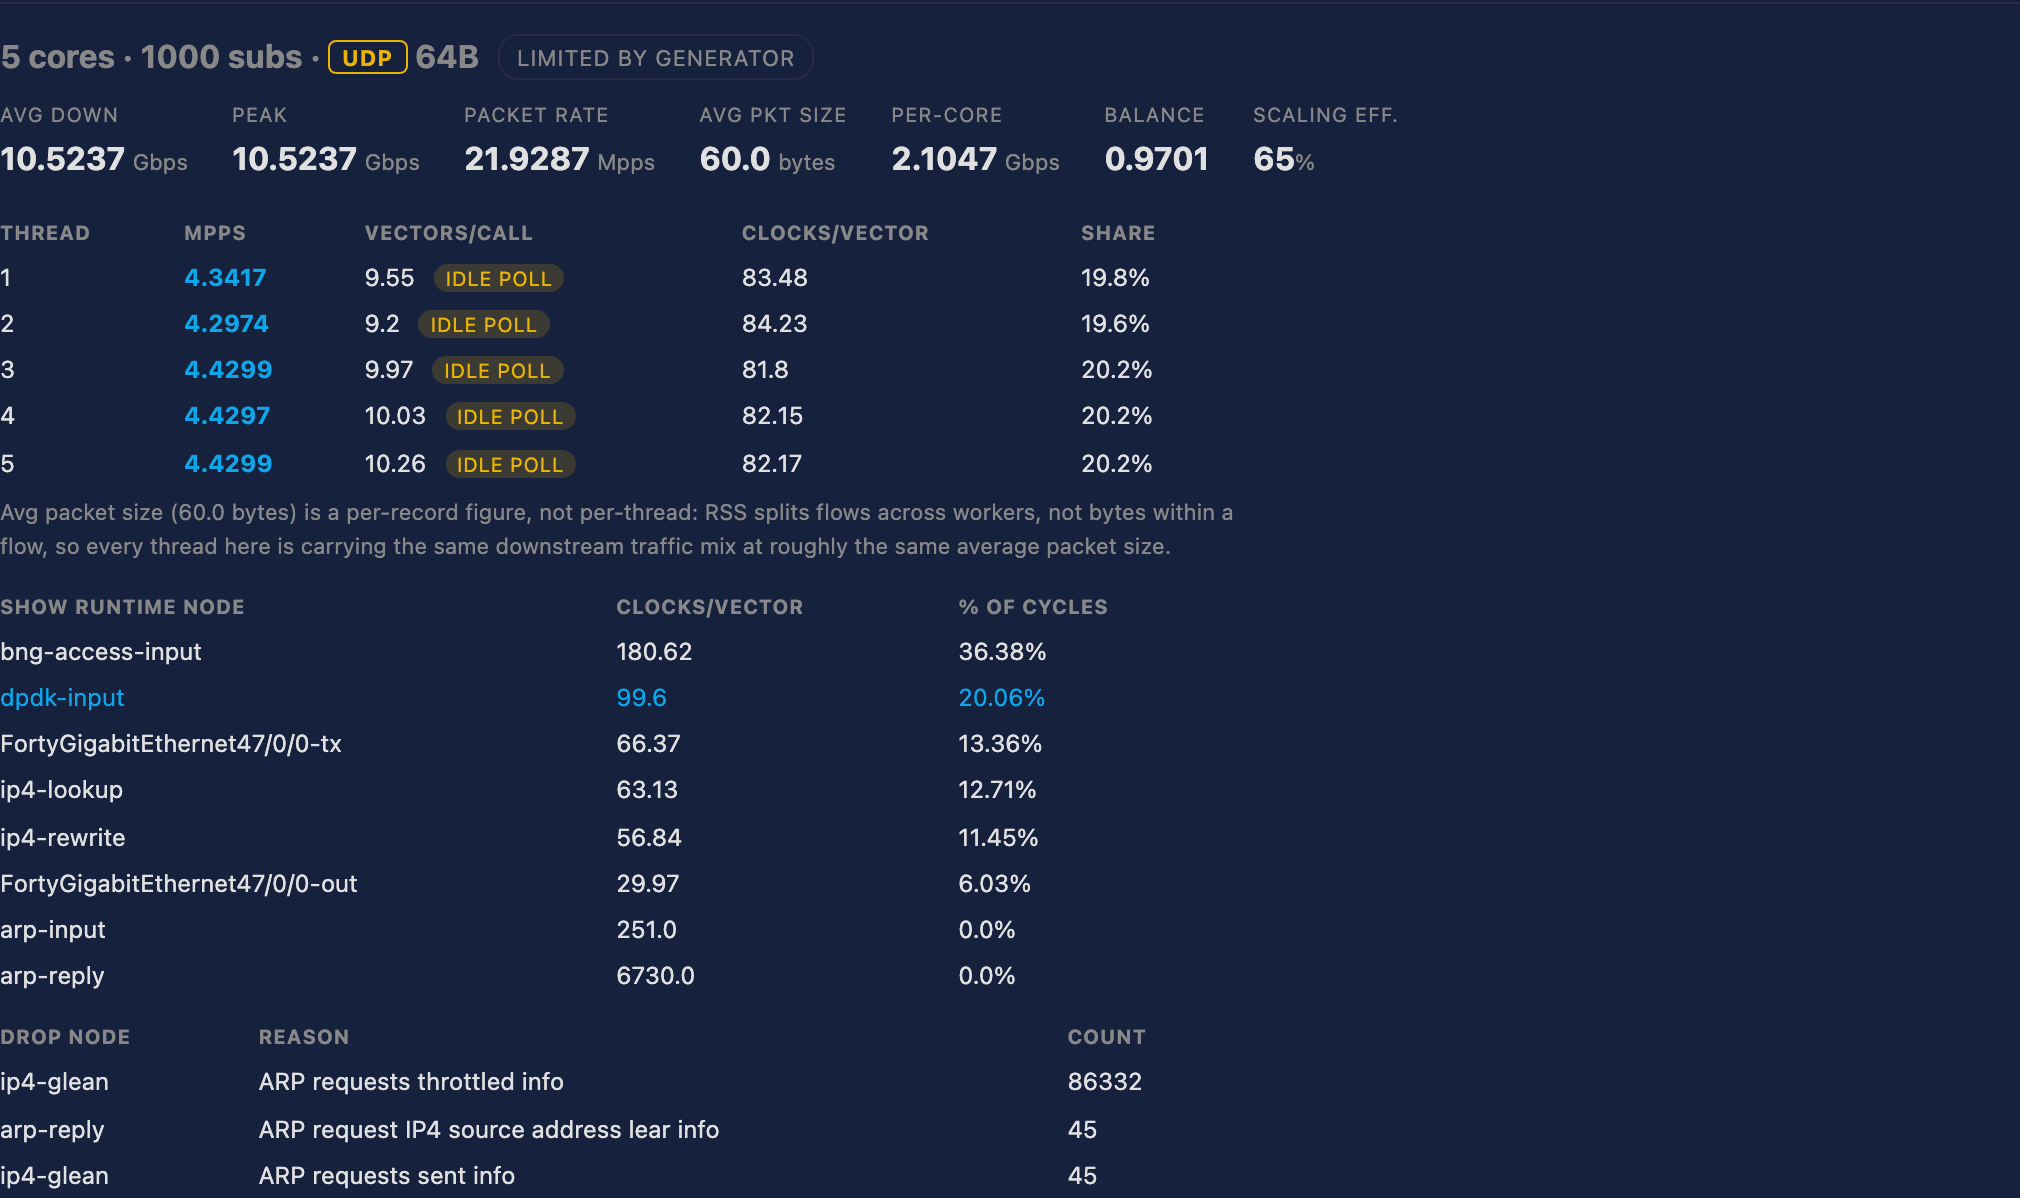
Five different dataplane configurations returning one identical figure is the
signature of a constraint that is not the dataplane. The rig's ceilings are
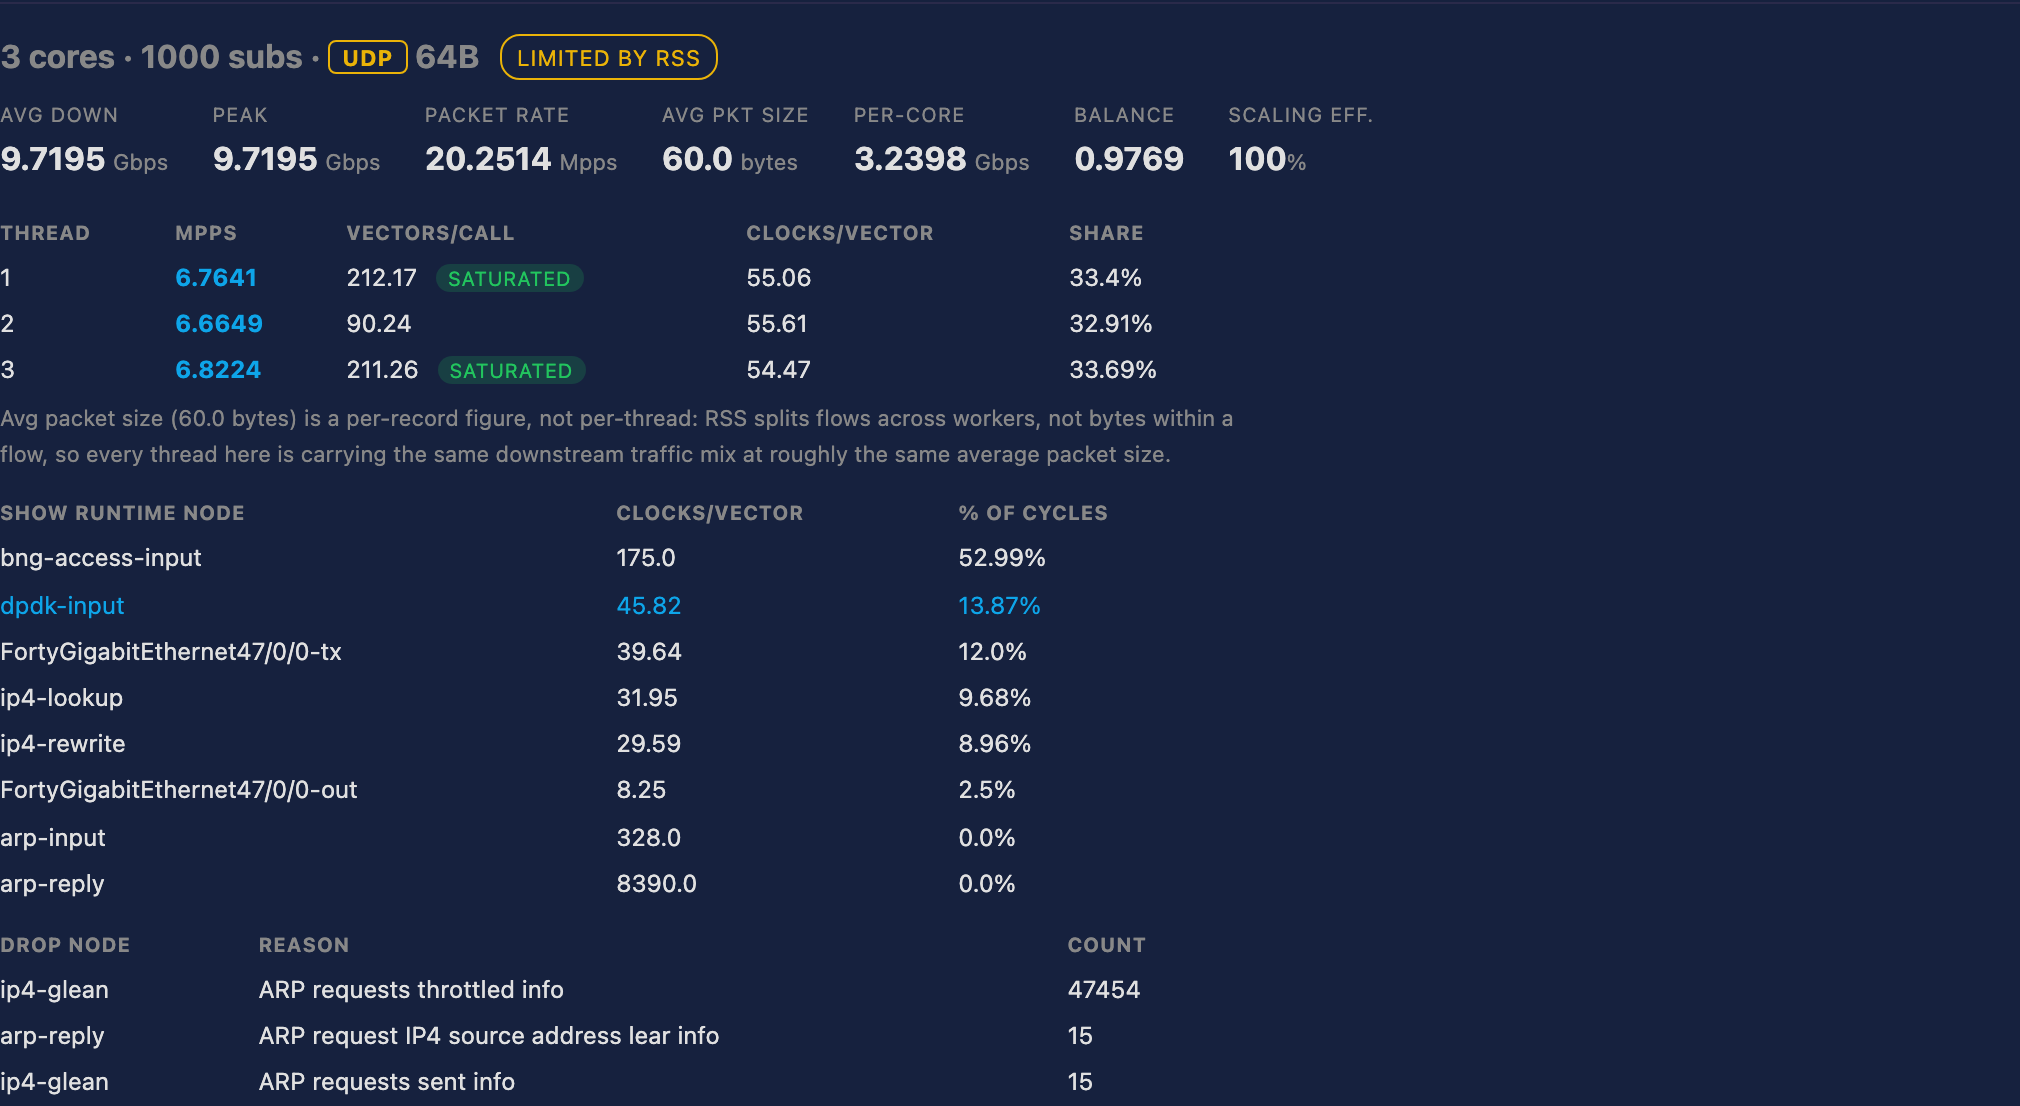
~20 Gbps aggregate, 15.2 Mpps at 128B and 21.93 Mpps at 64B.
For the 512 B and 1518 B rows this is line rate with zero loss: the box
forwarded every packet offered while the link was essentially full. Saturating
it at those frame sizes would need far more than the rig's 20 Gbps, so the cells
are the strongest reading available here, not a shortfall. The 64 B cells at
four and five workers are the genuine floors — there the rig simply under-offered.
Beyond two workers the 64 B cells stop finding a platform ceiling. At three
workers that cell becomes RSS-limited; at four and five the rig under-offers:
5.8 Local-AAA performance — run-699-aaa.json
What it measures. Four experiments against the platform's own subscriber
store, each carrying its own limited_by.
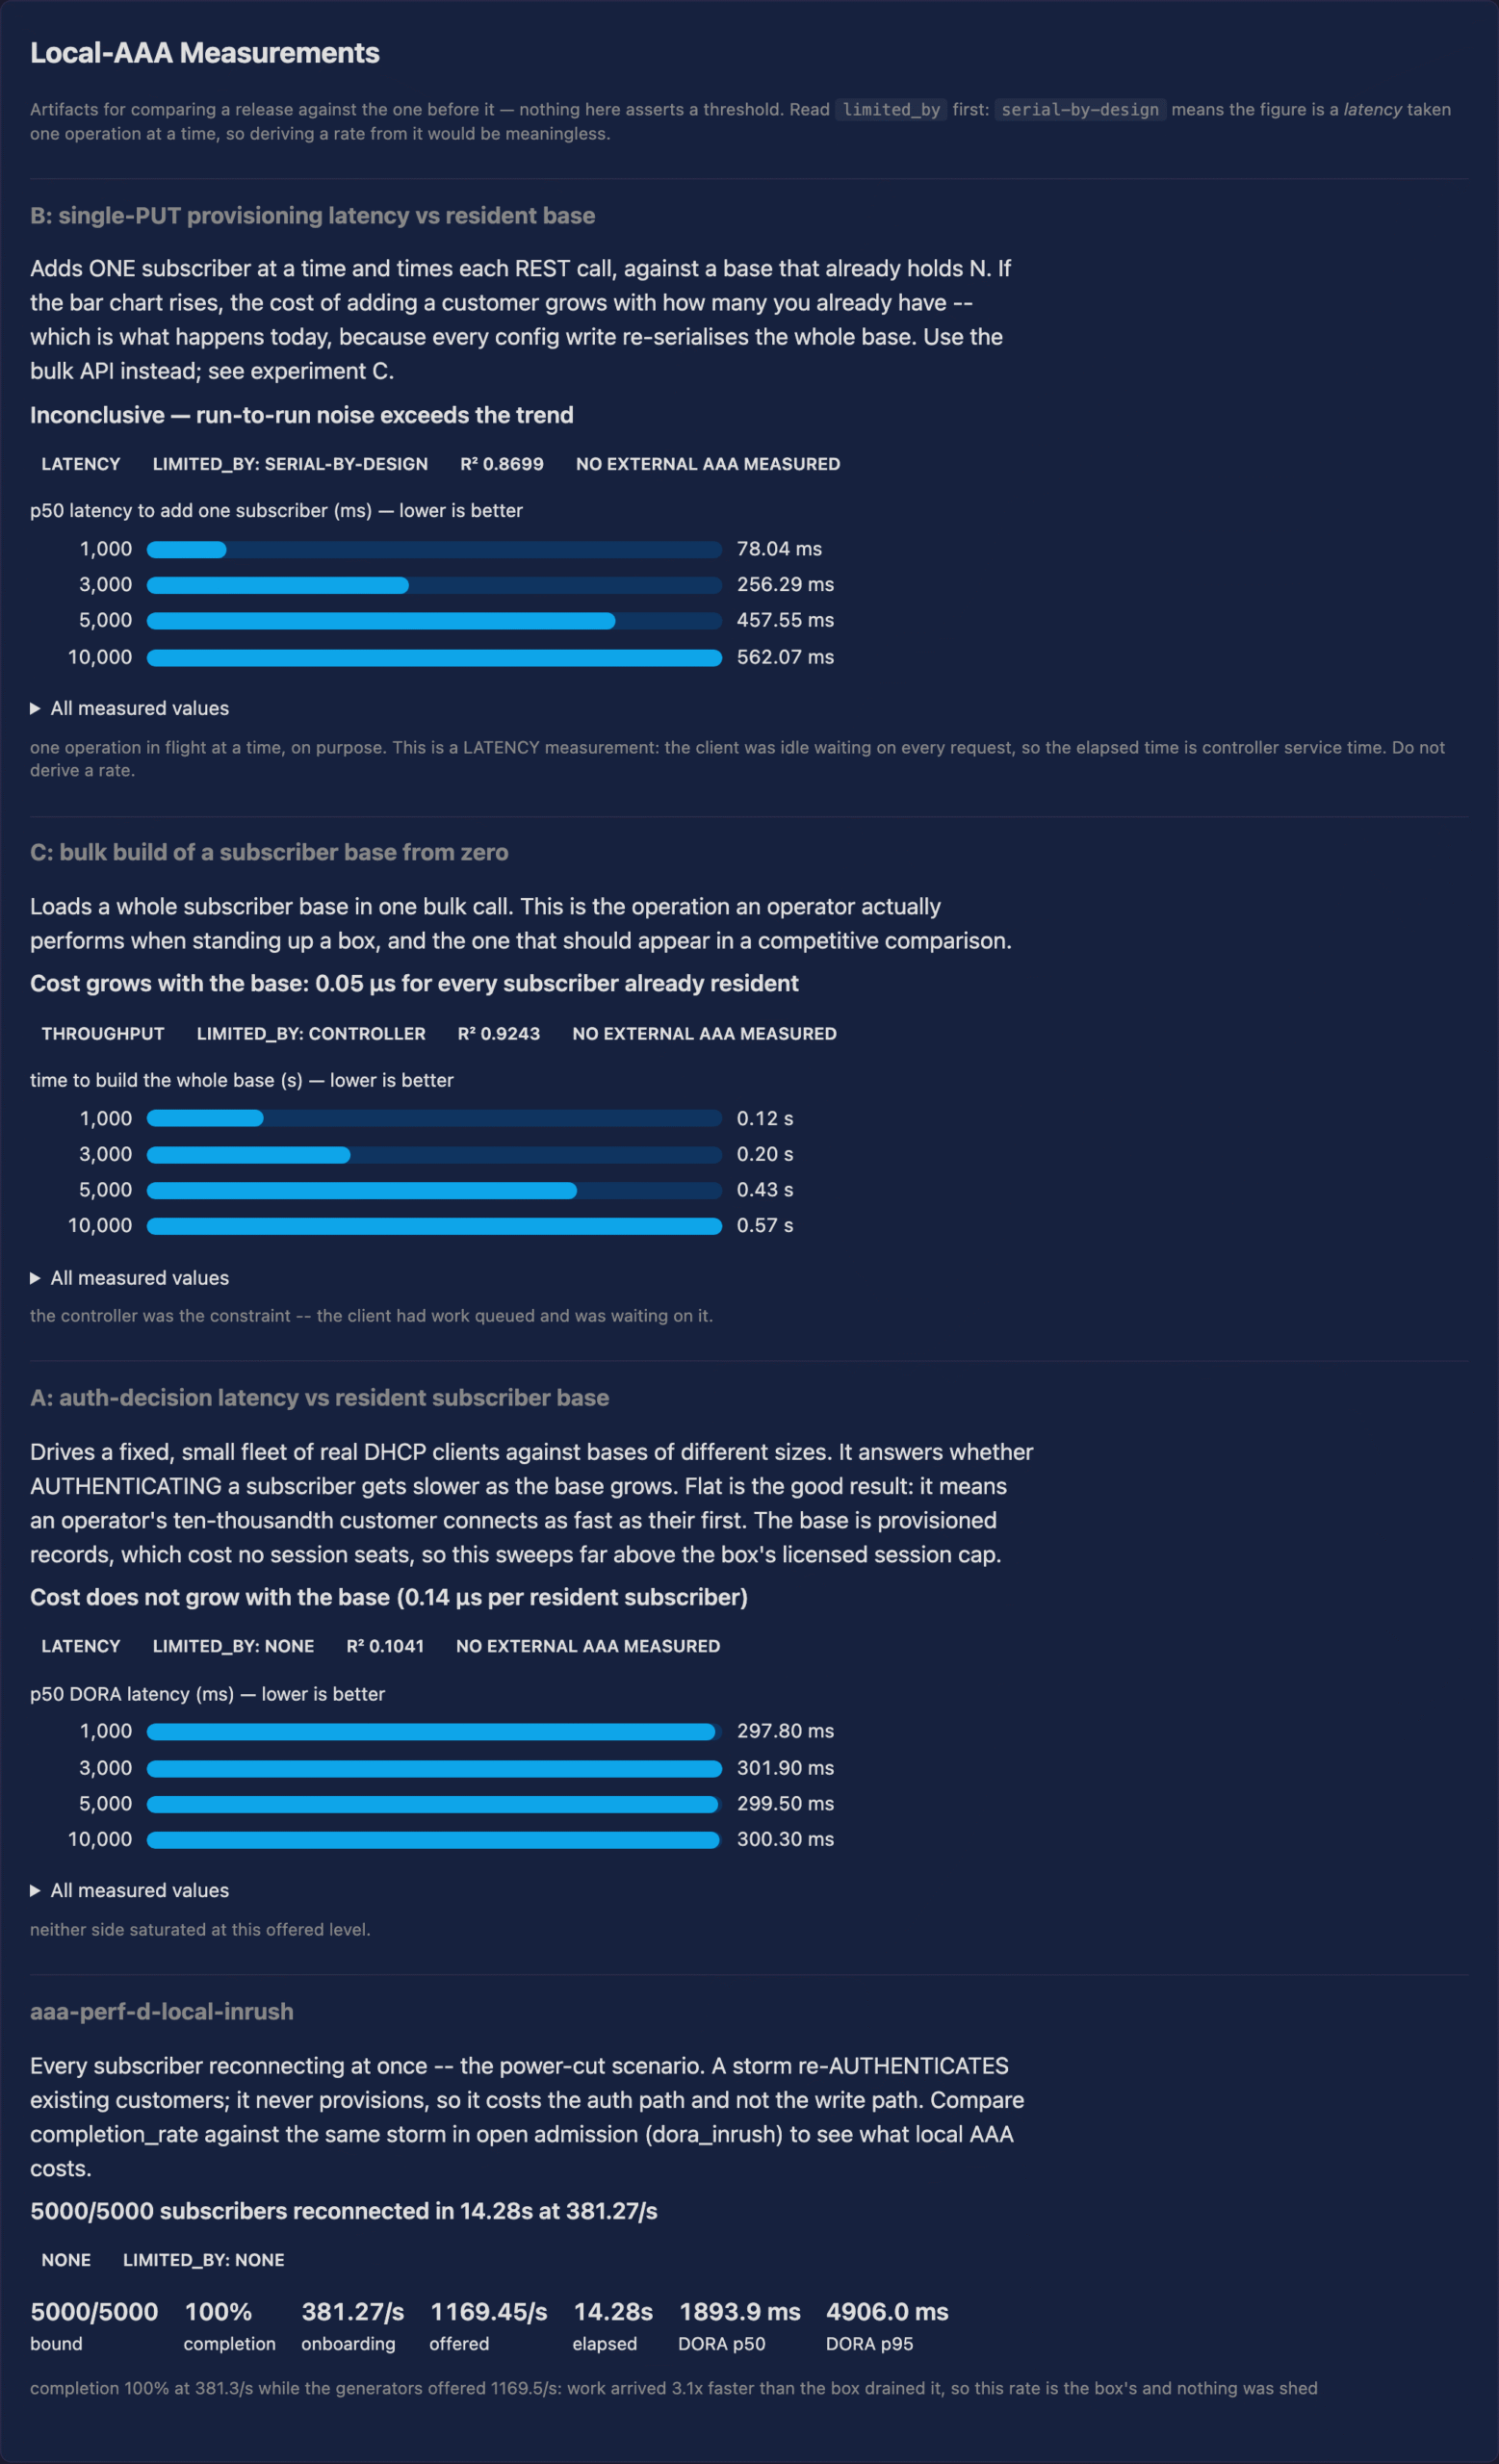
A — authentication latency. limited_by: none. Cost is flat in the
resident base: 0.14 µs per resident subscriber with r² = 0.10, i.e. no
meaningful slope. Across the measured sweep — bases of 1,000, 3,000, 5,000 and
10,000 — p50 DORA latency sits between 297.8 ms and 301.9 ms. Authenticating
against the largest base measured costs what it costs against the smallest. The
sweep does not extend to the 25,000 licensed cap.
B — single-subscriber provisioning. limited_by: serial-by-design — one
operation in flight on purpose. This is a latency measurement and must not be
read as a provisioning throughput figure.
C — bulk base build. limited_by: controller, so publishable with the
component named. Build time is linear in the resident base (O(N)): 0.05 µs
per resident subscriber, r² = 0.92. Adding one subscriber costs more as the base
grows — relevant when planning bulk imports.
D — local-AAA in-rush. 5,000 of 5,000 bound, completion 100% at
381.3/s, with offered_headroom = 3.07: work arrived 3.1× faster than the
box drained it, so this rate is the platform's own.
The cost of local-AAA admission. Comparing D against the open-admission
cold in-rush in §5.2 — the same storm, differing only in admission — gives
381.3/s against 391.8/s. Local-AAA admission costs 2.7%. This is the only
clean measurement of it in the suite.
5.9 Unauthenticated admission — run-699-unauth.json
What it measures. A layered probe: ICMP, TCP and HTTP from identities at
varying degrees of legitimacy, verifying the walled garden admits what it should
and no more.
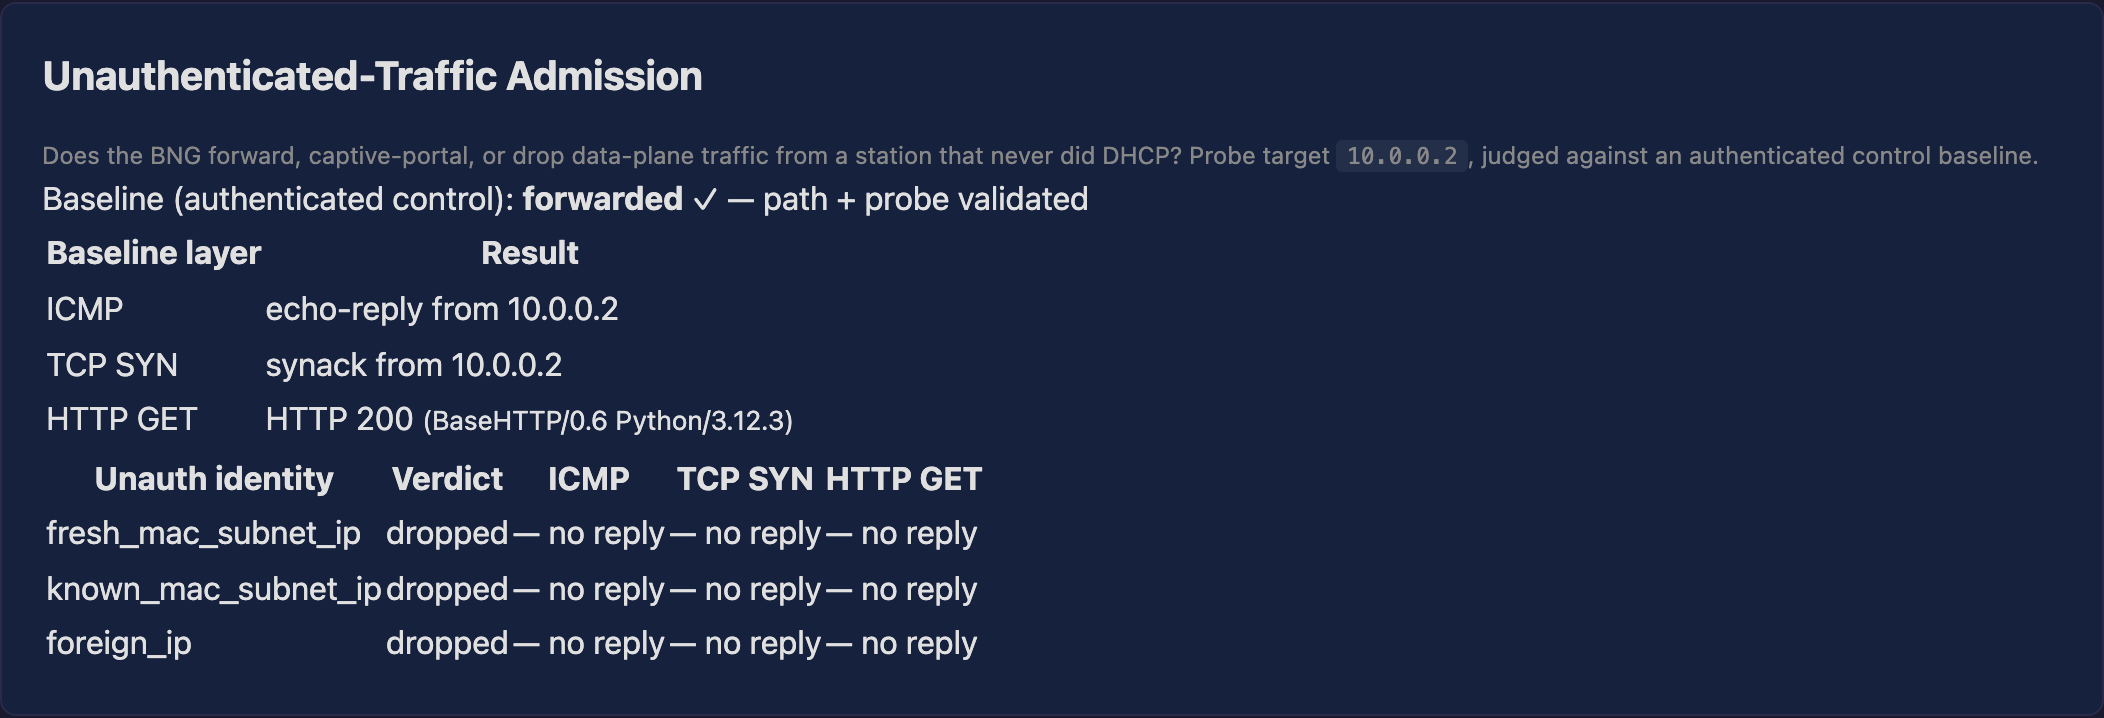
The baseline identity forwarded correctly at all three layers (ICMP echo-reply,
TCP SYN-ACK, HTTP 200), establishing that the probe itself works before the
restrictive cases are read. All admission checks passed.
5.10 Management surface
The console, licence API, security and authentication suites all passed, with
two exceptions recorded in §6. These cover API key handling, role enforcement,
session security, licence activation and the console's own rendering.