
Step 5 — Set the dashboard variables
Every dashboard has Data source and BNG box. Two dashboards add more.
BNG box — leave it on All, and expect it to be empty
If you have one Grafana reading one BNG, the dropdown will be empty and that
is correct. BNG metrics carry plane and box as Prometheus external
labels, which are attached when Prometheus sends data onward — federation,
remote write, alerting — and are never written into its own local storage. A
Prometheus scraping a single BNG therefore has no box label on any series.
All interpolates to "match everything", so every panel works regardless.
Federate several BNGs into one Prometheus and the dropdown fills in by itself,
and you can then switch between boxes on the same dashboards.
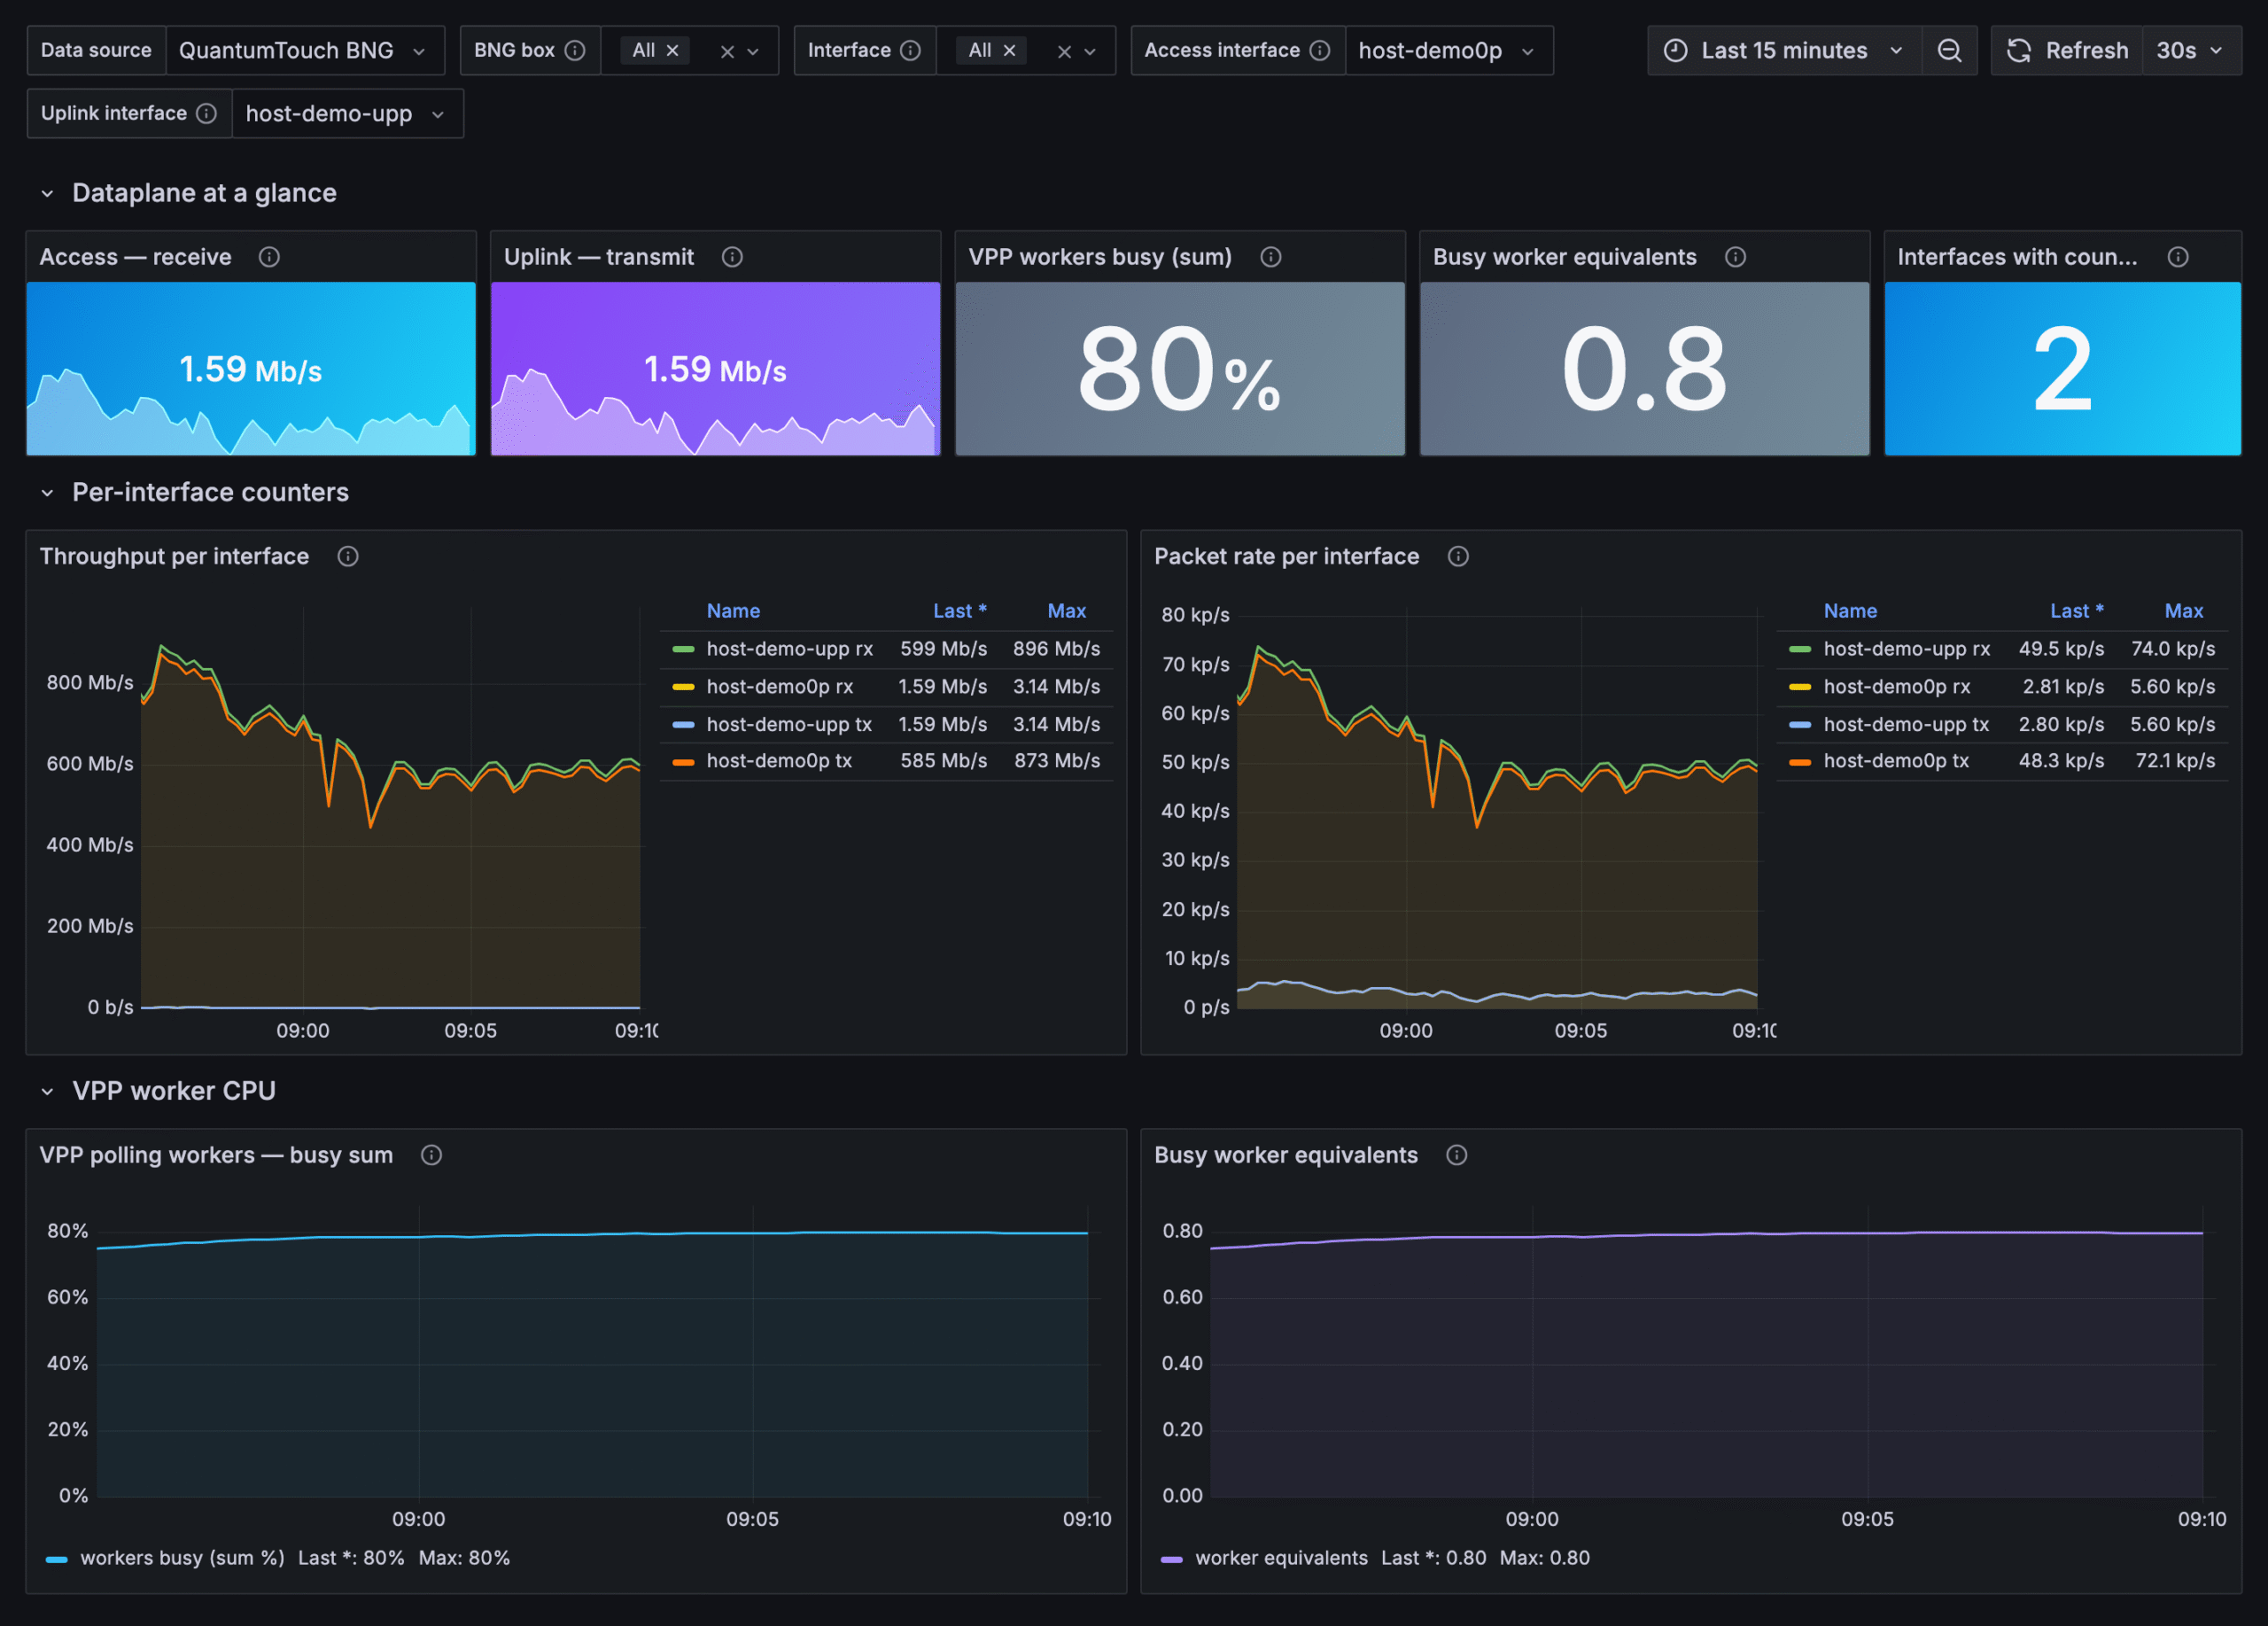
Access interface / Uplink interface — set these once, then save
On the Interfaces & Dataplane dashboard these default to the reference box's
port names and will not match yours. Pick your real interfaces from the
dropdowns and save the dashboard.
Which port faces subscribers and which faces the network is a fact about your
deployment, so the dashboard asks rather than guessing. Only the two summary
tiles at the top use these; the graphs below plot every interface and need no
configuration.
Interface, Temperature sensor
Multi-select filters, default to all. Nothing to configure.