
Step 3 — Add the BNG as a Prometheus datasource
Prometheus runs on the BNG, bound to 127.0.0.1:9090, and is deliberately
not reachable from your network. The way in is an authenticated read-only proxy
on the console port. It speaks native Prometheus — same JSON, same status
codes — so a stock Prometheus datasource works against it unmodified.
In Grafana: Connections → Data sources → Add new → Prometheus.
| Field | Value |
|---|---|
| URL | https://<bng-host>:8443/api/bng/prometheus |
| HTTP method | POST |
| Custom HTTP header — name | Authorization |
| Custom HTTP header — value | Bearer <your token> |
Paste only that base URL. Grafana appends its own suffixes (/api/v1/query_range
and so on) when it queries.
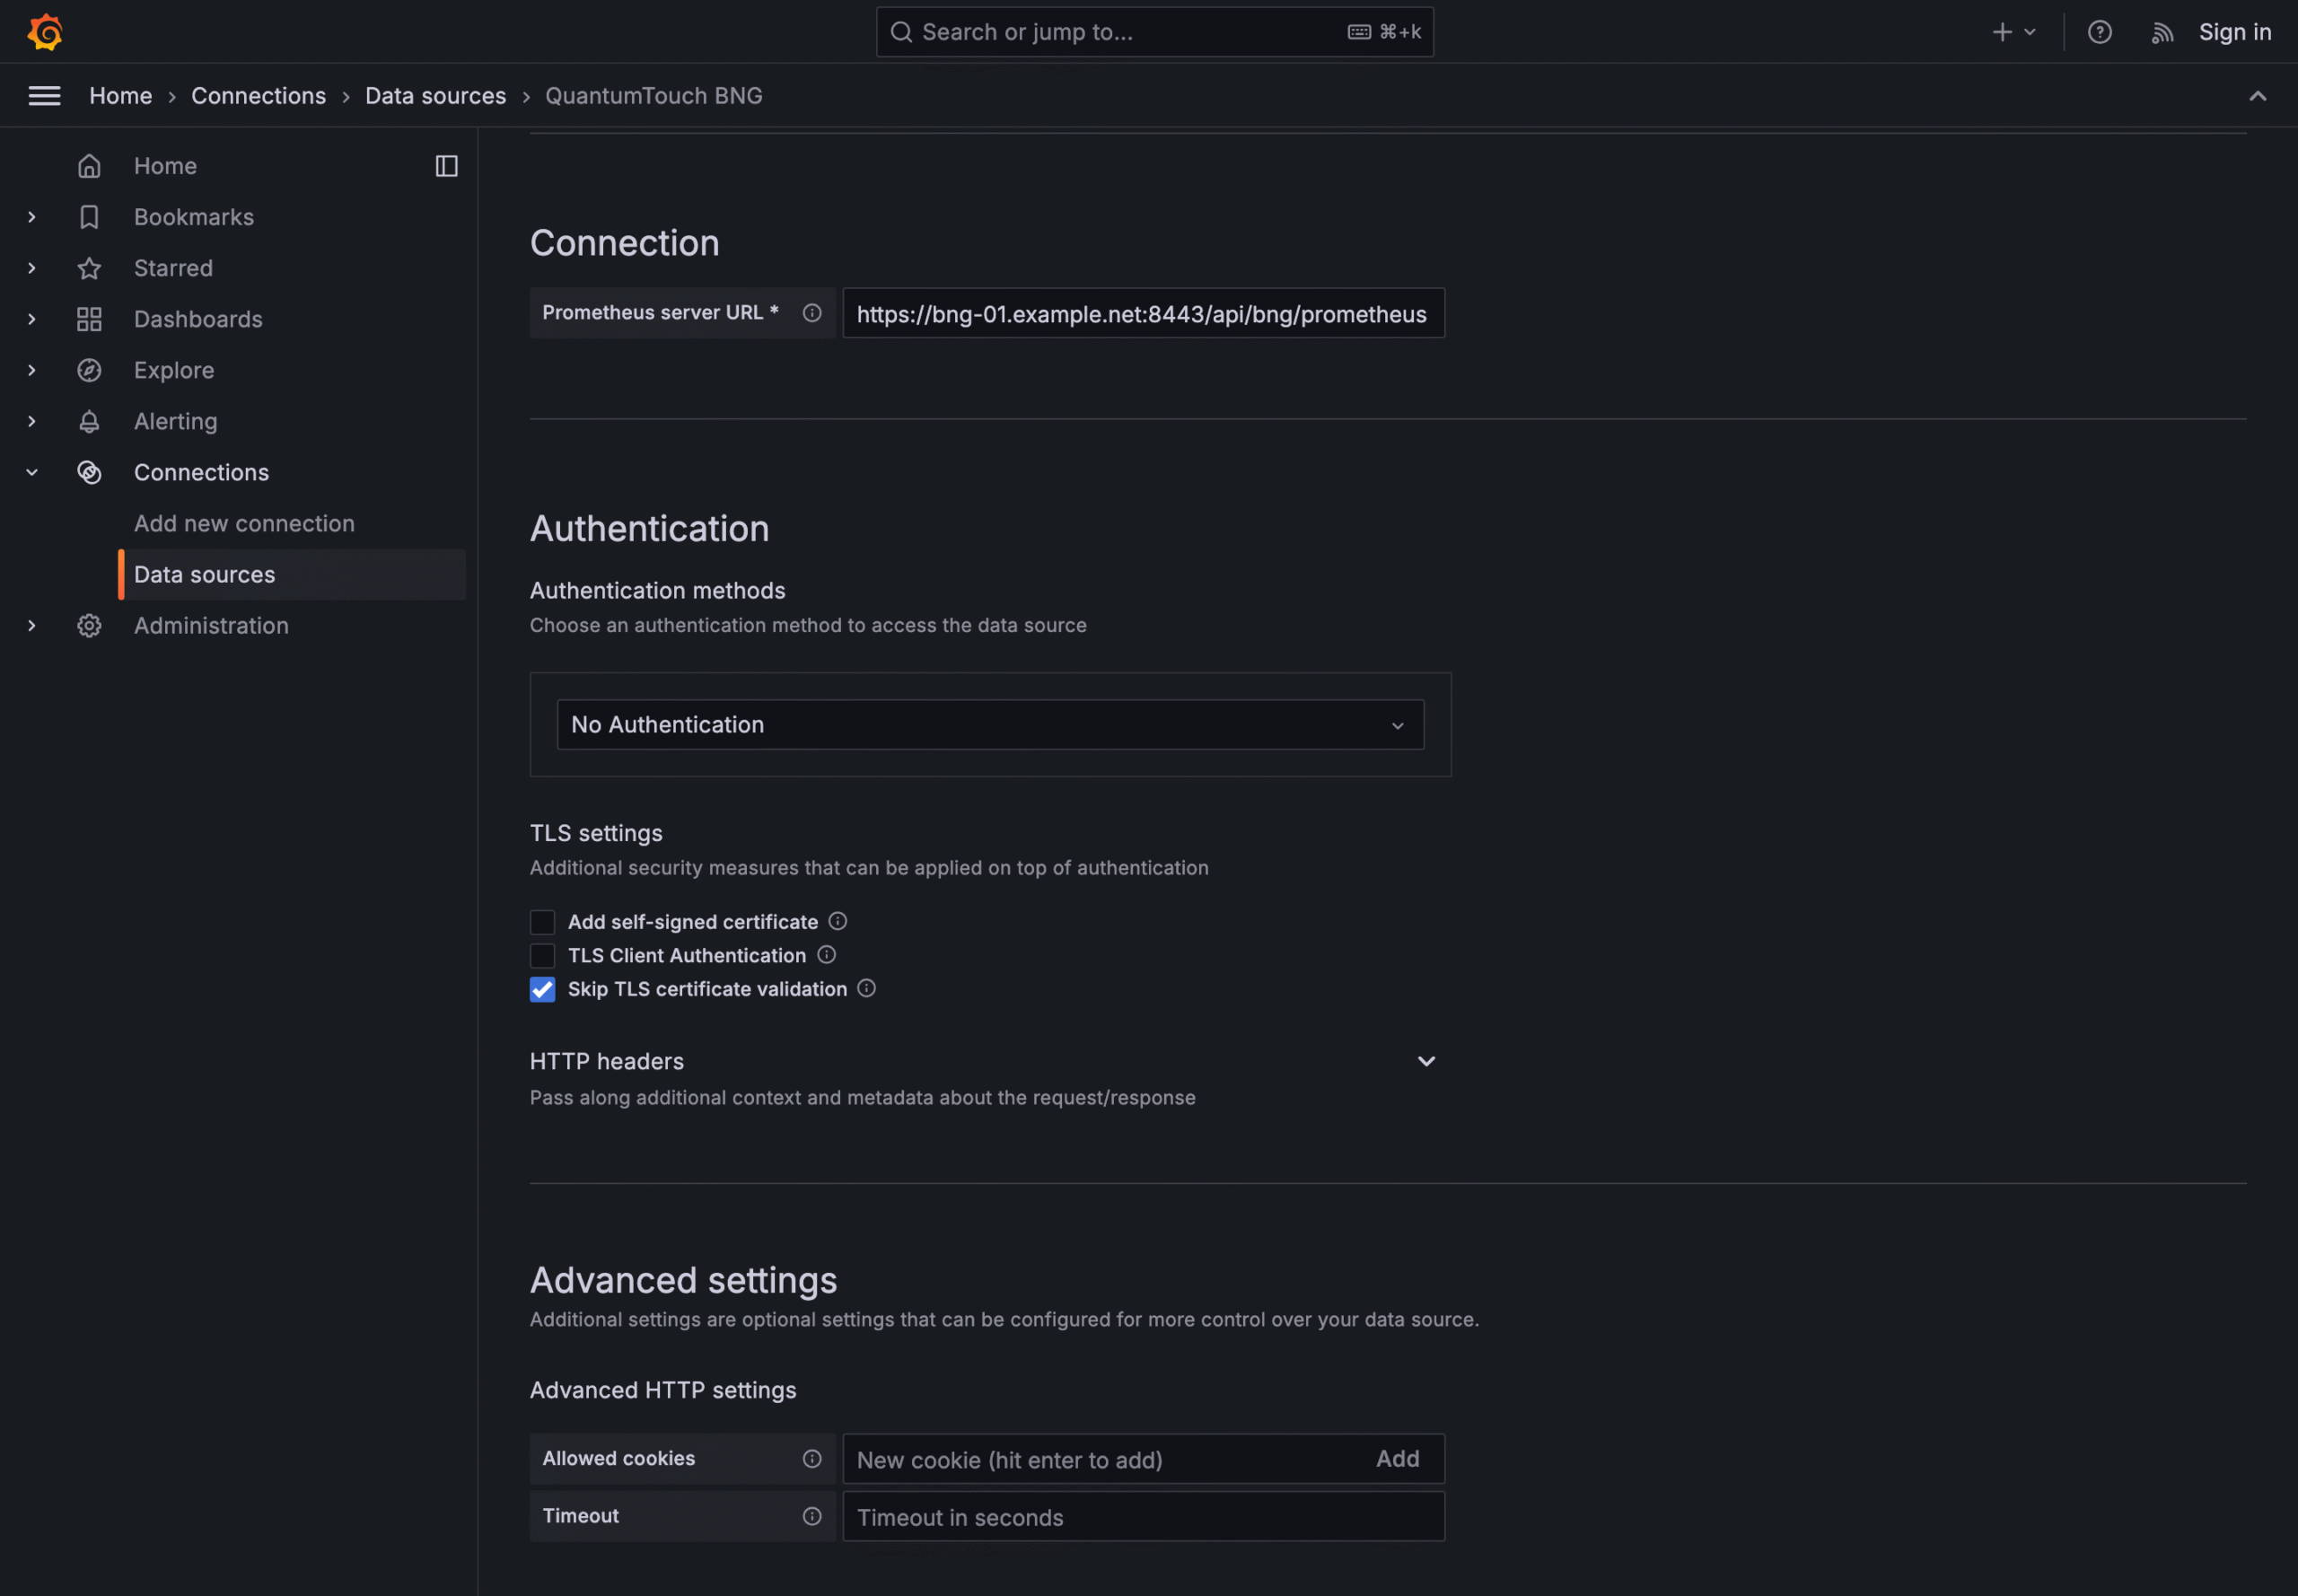
TLS
By default the BNG serves a certificate that is self-signed or signed by the
box's own private CA, so Grafana will refuse the connection until you deal with
it. Two options:
- Install the BNG's certificate into Grafana's trust store. The right
choice whenever Grafana reaches the box over a routable network. With
verification on, Grafana can tell if something other than the BNG answers on
that address. Without it, it cannot — and the Bearer token above is exactly
what an interposer would collect. - Enable "Skip TLS certificate verification." Acceptable only on a link you
trust end to end, such as Grafana and the BNG on the same isolated management
network. Do not make this the default on a shared network.
If your BNG was installed with your own certificate (QT_CUSTOMER_CERT /
QT_CUSTOMER_KEY) and that certificate already chains to a CA Grafana trusts,
neither applies — it just works, and you should not disable verification.
Click Save & test. Grafana calls /api/v1/status/buildinfo, which the proxy
allows; a healthy datasource reports "Successfully queried the Prometheus API."