
Step 5 — Take a quick tour
The Dashboard page is the operator's default landing spot. Nothing is happening yet — no subscribers, no traffic — so most of the counters read zero. That's the appliance behaving correctly on a fresh install.
The pages worth glancing at before we start pushing traffic (all reachable from the left-nav):
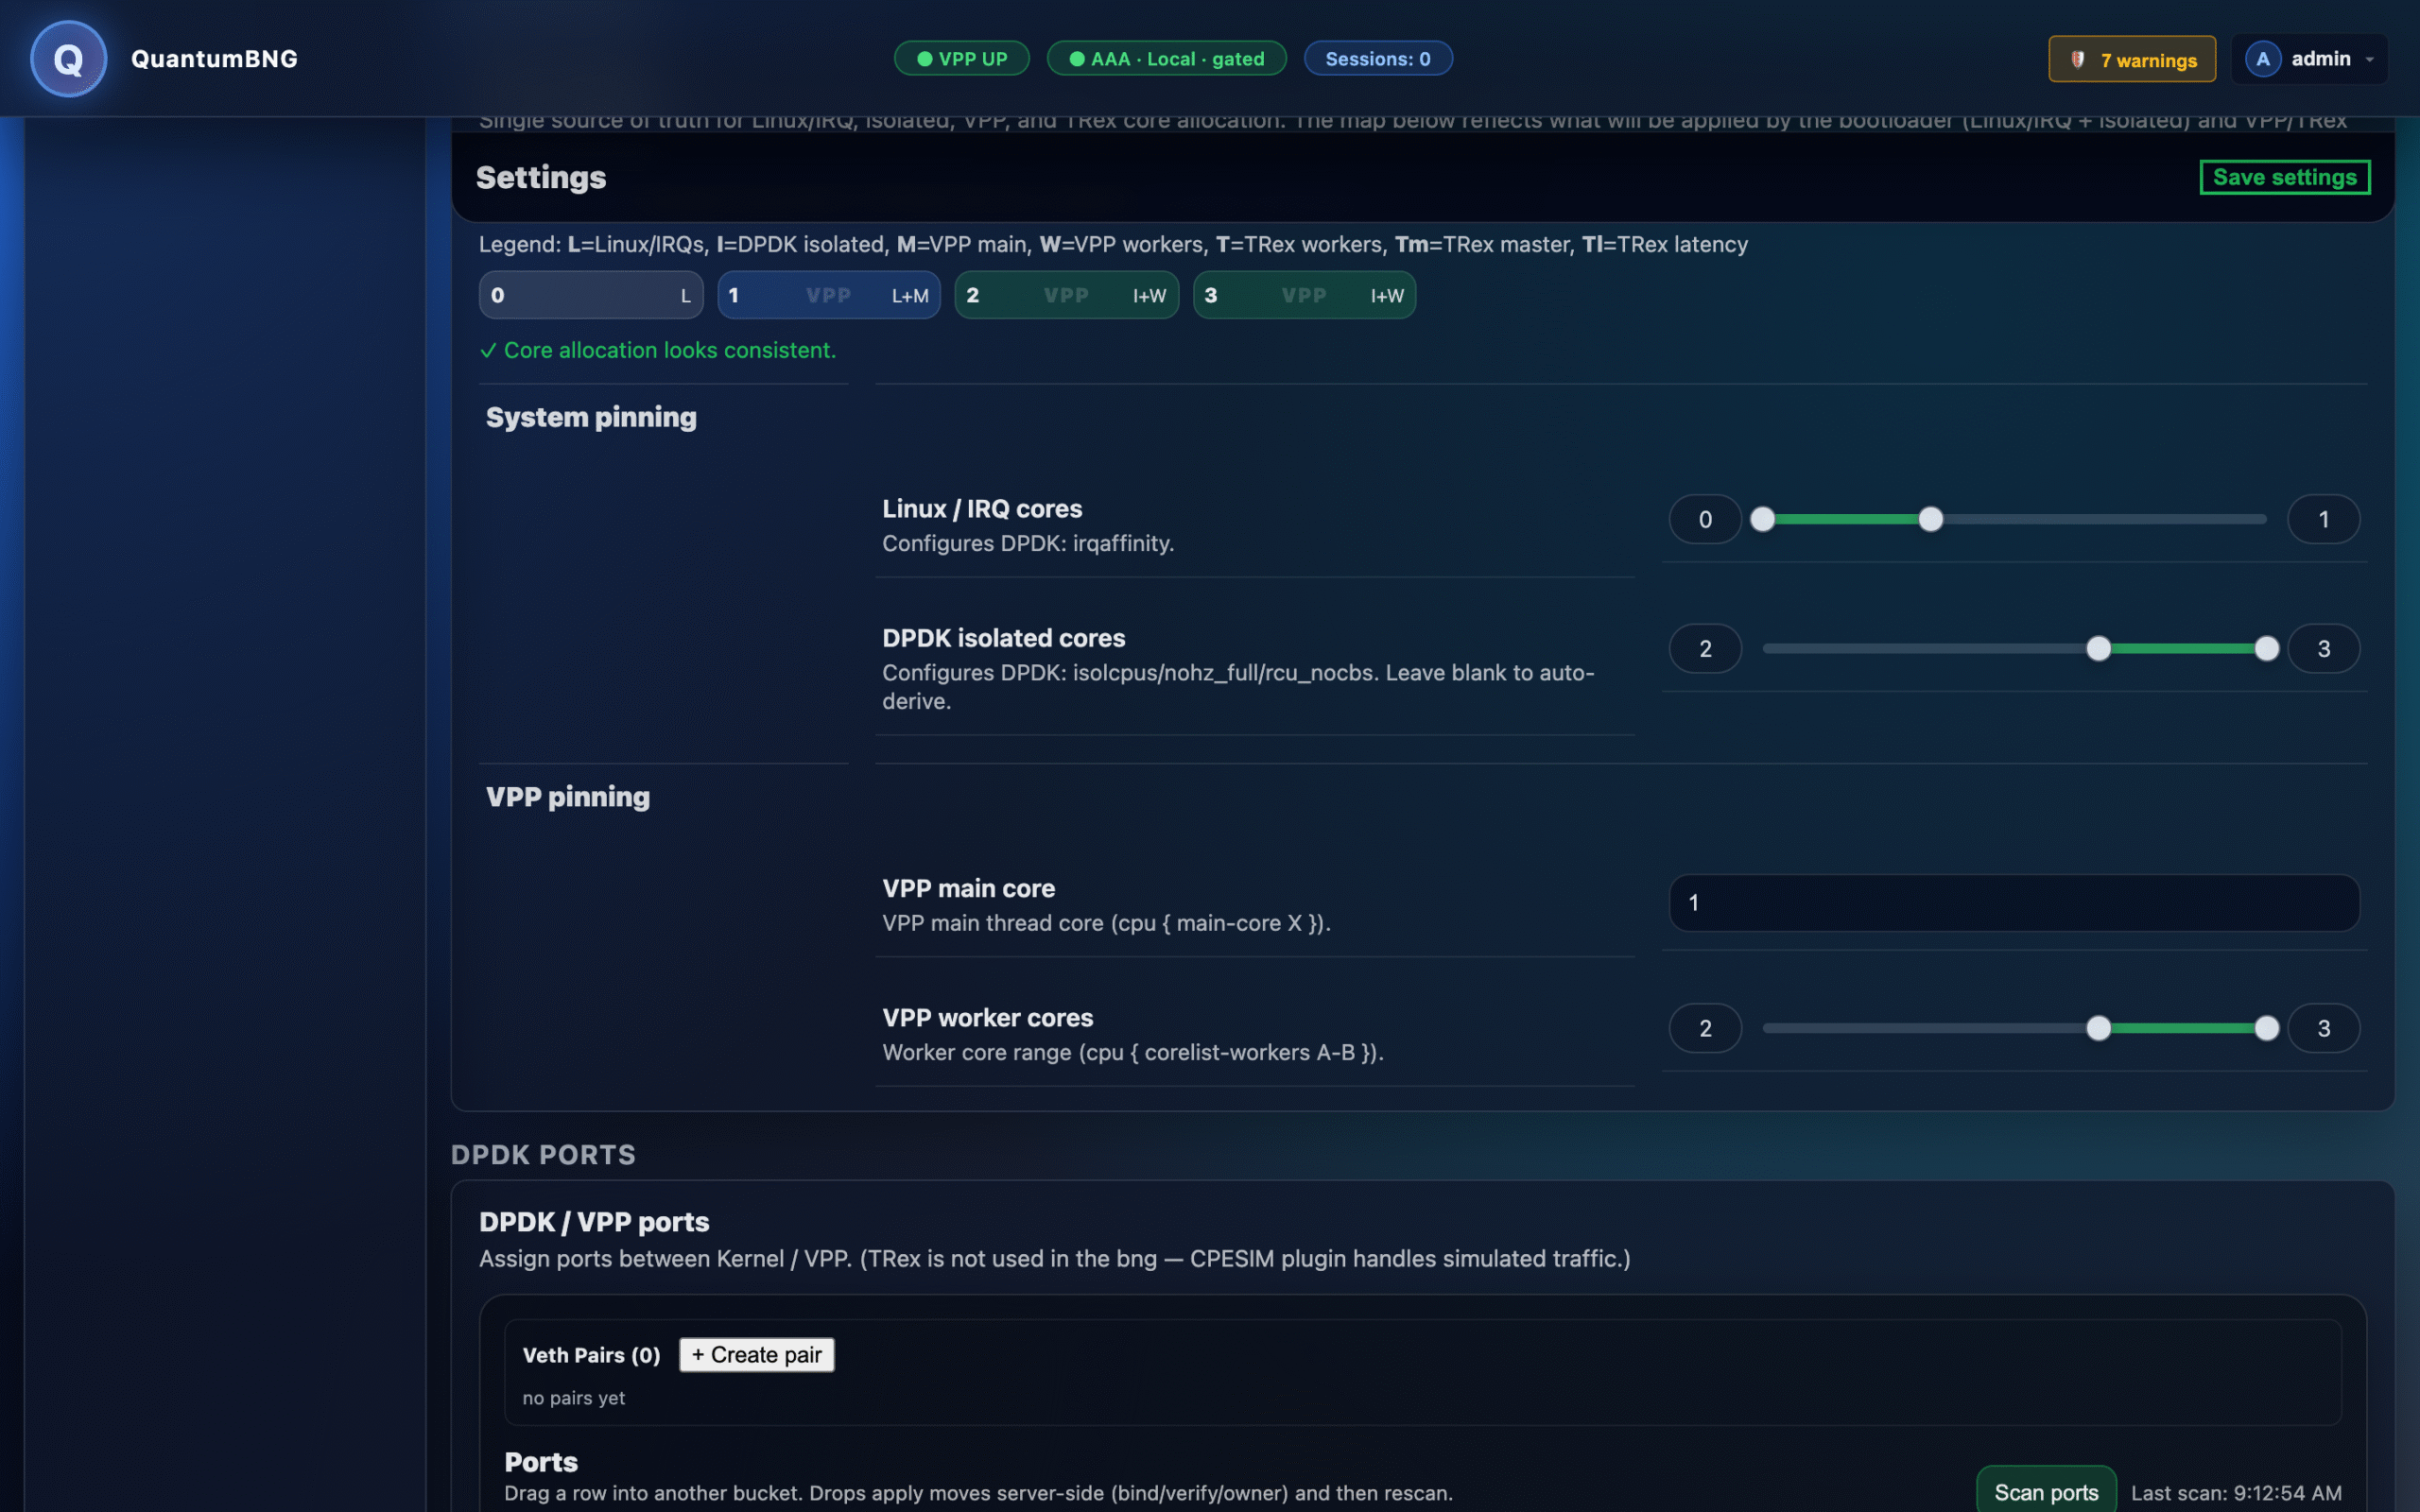
Settings → CPU Mapping. Confirms the appliance is running the four vCPUs the way the wizard configured them: Linux + IRQs on core 0 and 1, VPP main thread on core 1, VPP worker threads on cores 2 and 3, DPDK-isolated range covering the workers. The section opens with a green ✓ "Core allocation looks consistent" banner — this is what a healthy pinning configuration looks like:
Dataplane. Shows the two internal veth interfaces the wizard created for you: veth-uplink-vpp (upstream side) and veth-access-vpp (subscriber side). Because VirtualBox has no way to hand a physical NIC through to VPP, all traffic in this appliance flows through these virtual pairs — perfect for a functional evaluation, not for real throughput benchmarking.
Pools & DNS. Shows the default pool at 100.64.0.0/24. That's CGN space (RFC 6598) — the same address range real ISPs use behind their BNG. When we start CPESIM in the next step, subscribers get IP leases out of this pool.
Subscriber Plans. Shows a single Bronze service plan: 20/25 Mbps down (CIR/PIR), 10/12 Mbps up. Every subscriber gets this plan unless you build another. Traffic that fits inside CIR (committed rate) is green on the dashboard, traffic in the CIR-to-PIR burst band is yellow, and anything over PIR is dropped at the QoS meter.
Audit. The audit timeline. Everything that happened during the first-boot bootstrap is recorded here — the admin account creation, the wizard-apply for each section, service startups, and any subsequent operator actions. This is the page you'd send to Bluedot support if something goes wrong later.